Data Feeds
As the first product designer at Chainlink Labs, redesigned Data Feeds for trust, clarity, and scalability — establishing a reusable product foundation other teams could build on.
Case study
Context
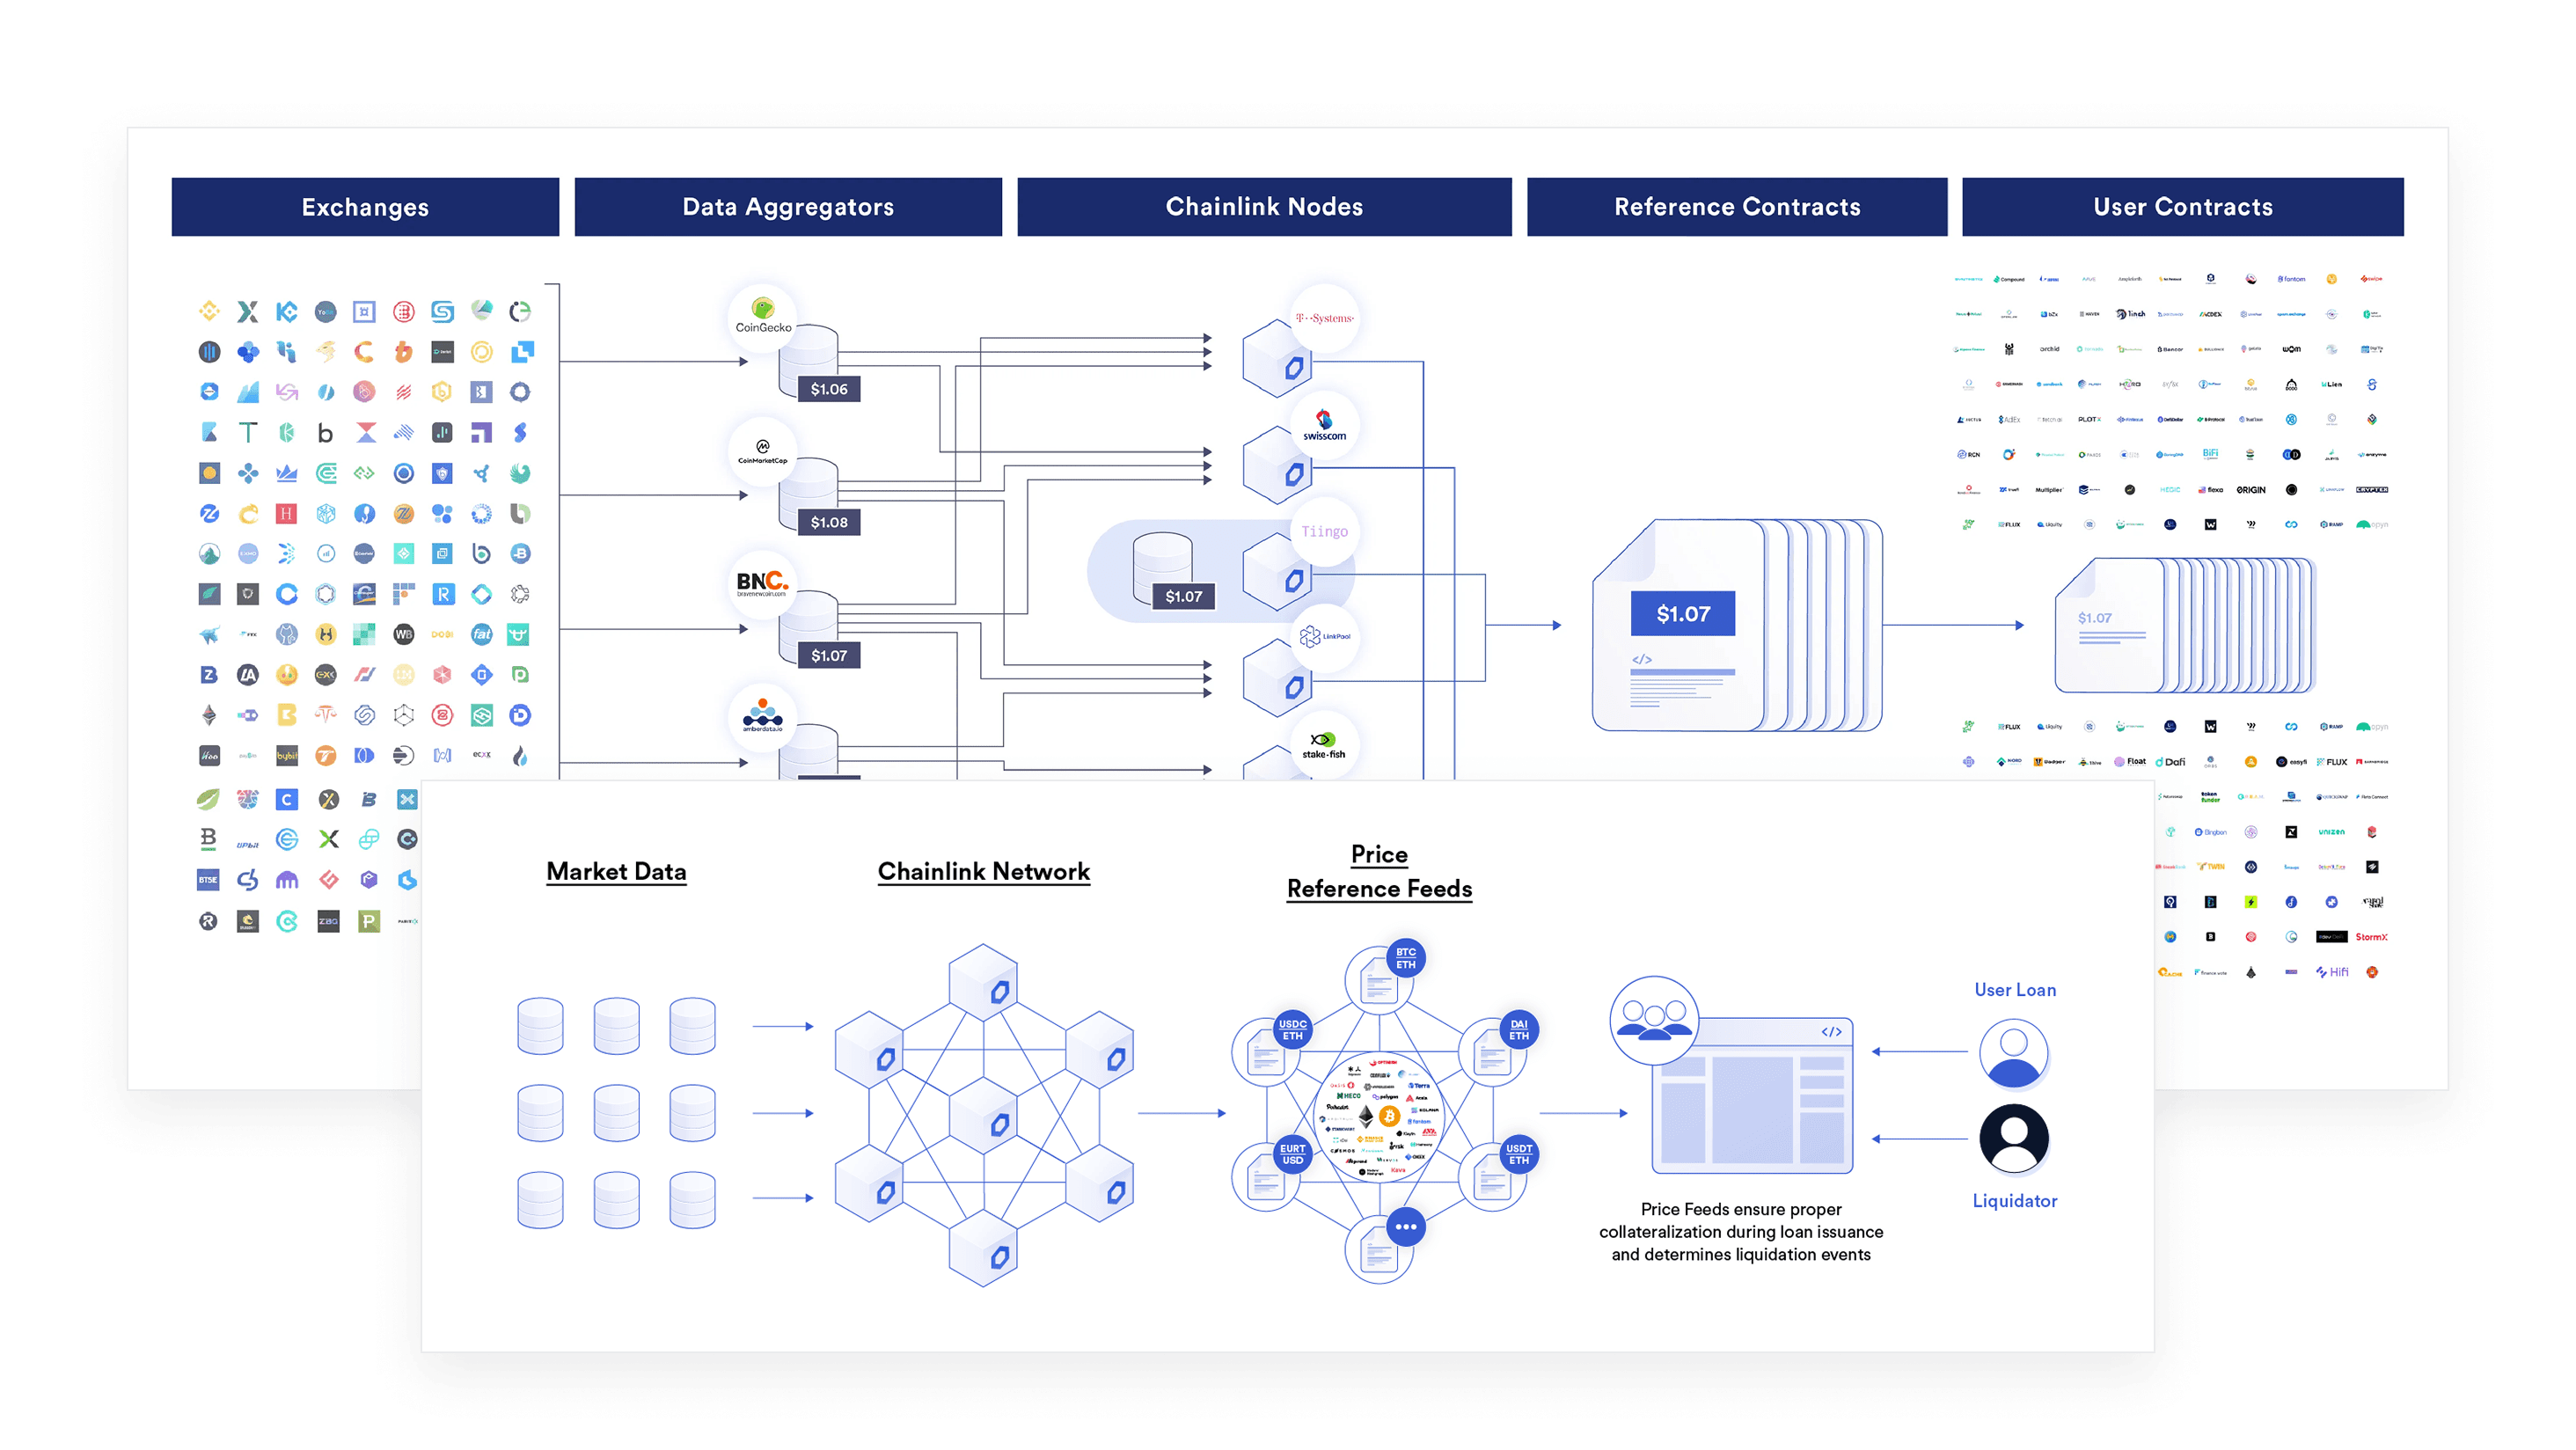
Chainlink enables smart contracts to access off-chain resources such as price data, verifiable randomness, and automation. Data Feeds aggregate multiple external data sources and publish them on-chain, providing reliable infrastructure for decentralized financial applications. By 2022, that infrastructure was securing billions of dollars across crypto markets.
Data Feeds had grown from an internal tool into a critical product, but the interface still reflected its origins. The work was to evolve it from a functional but utilitarian product into a scalable, trustworthy experience — one that communicated credibility to developers building high-stakes financial systems, aligned with a recently refreshed brand, and scaled within a React-based application.
total value secured by Chainlink
decentralized price feeds (fiat + crypto)
users and sponsors of the product
designer and engineers at the start
Problem
Data Feeds powered critical infrastructure, but the experience did not reflect its importance or scale.
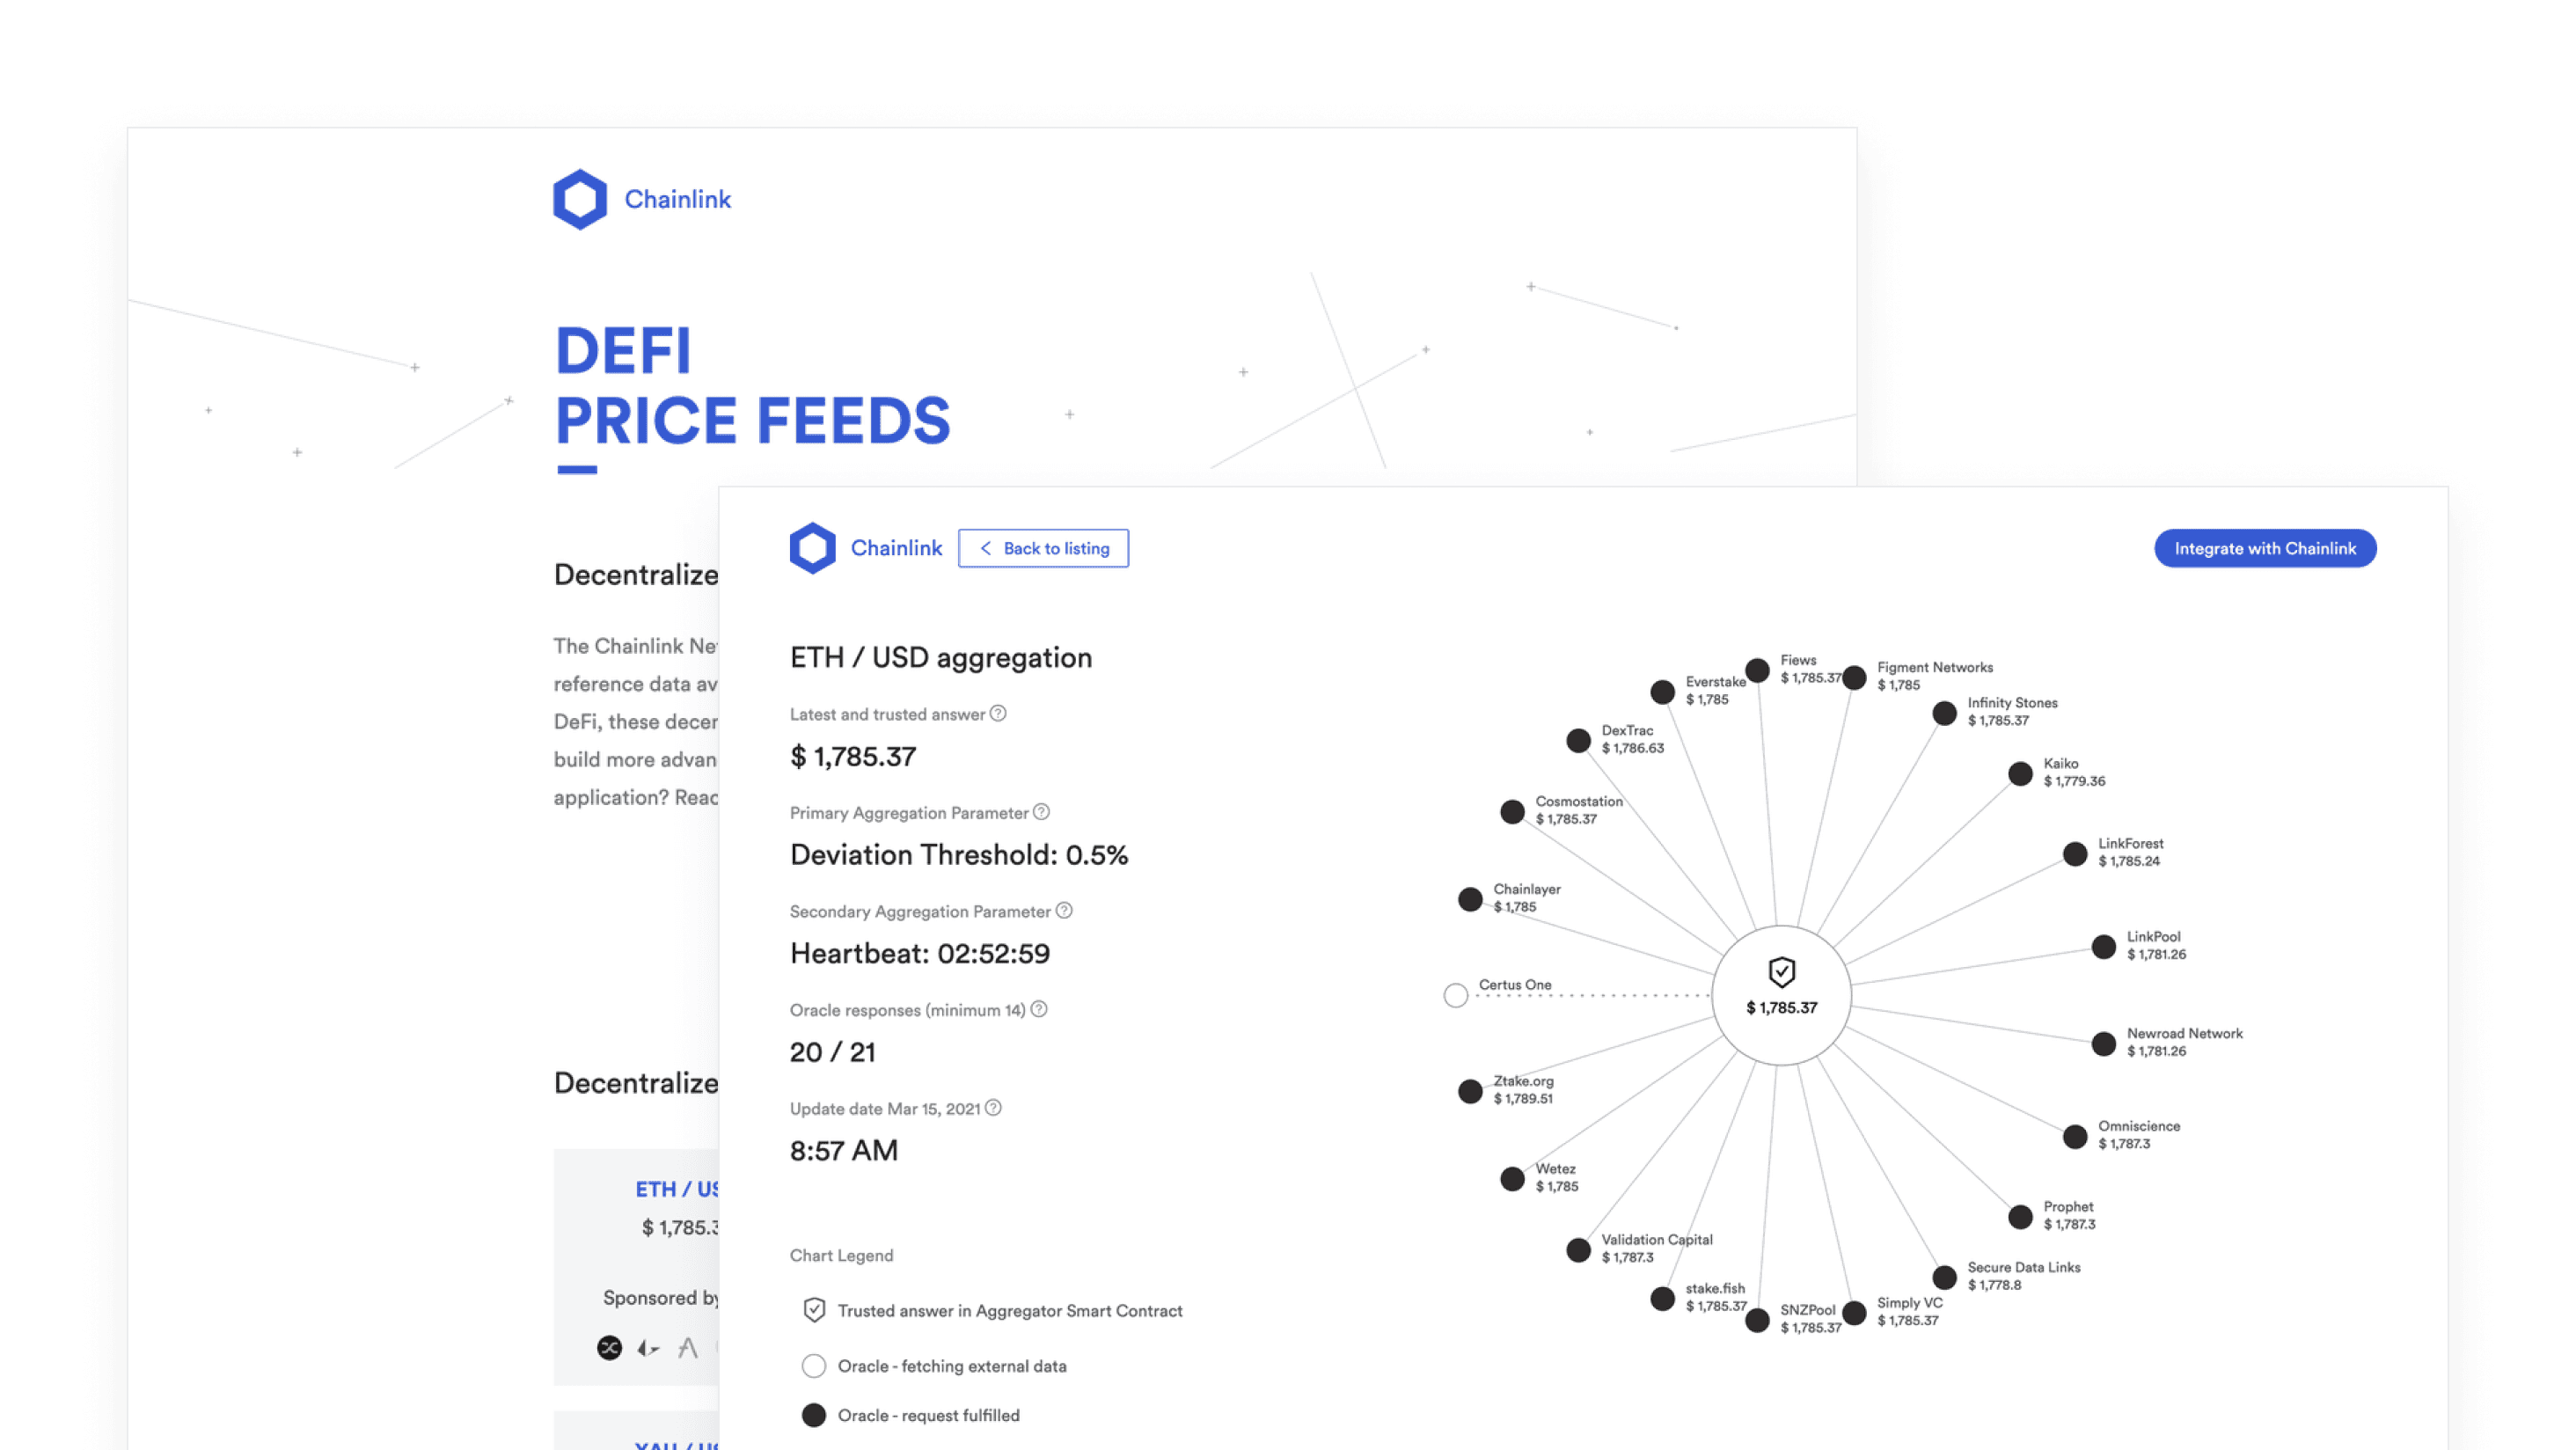
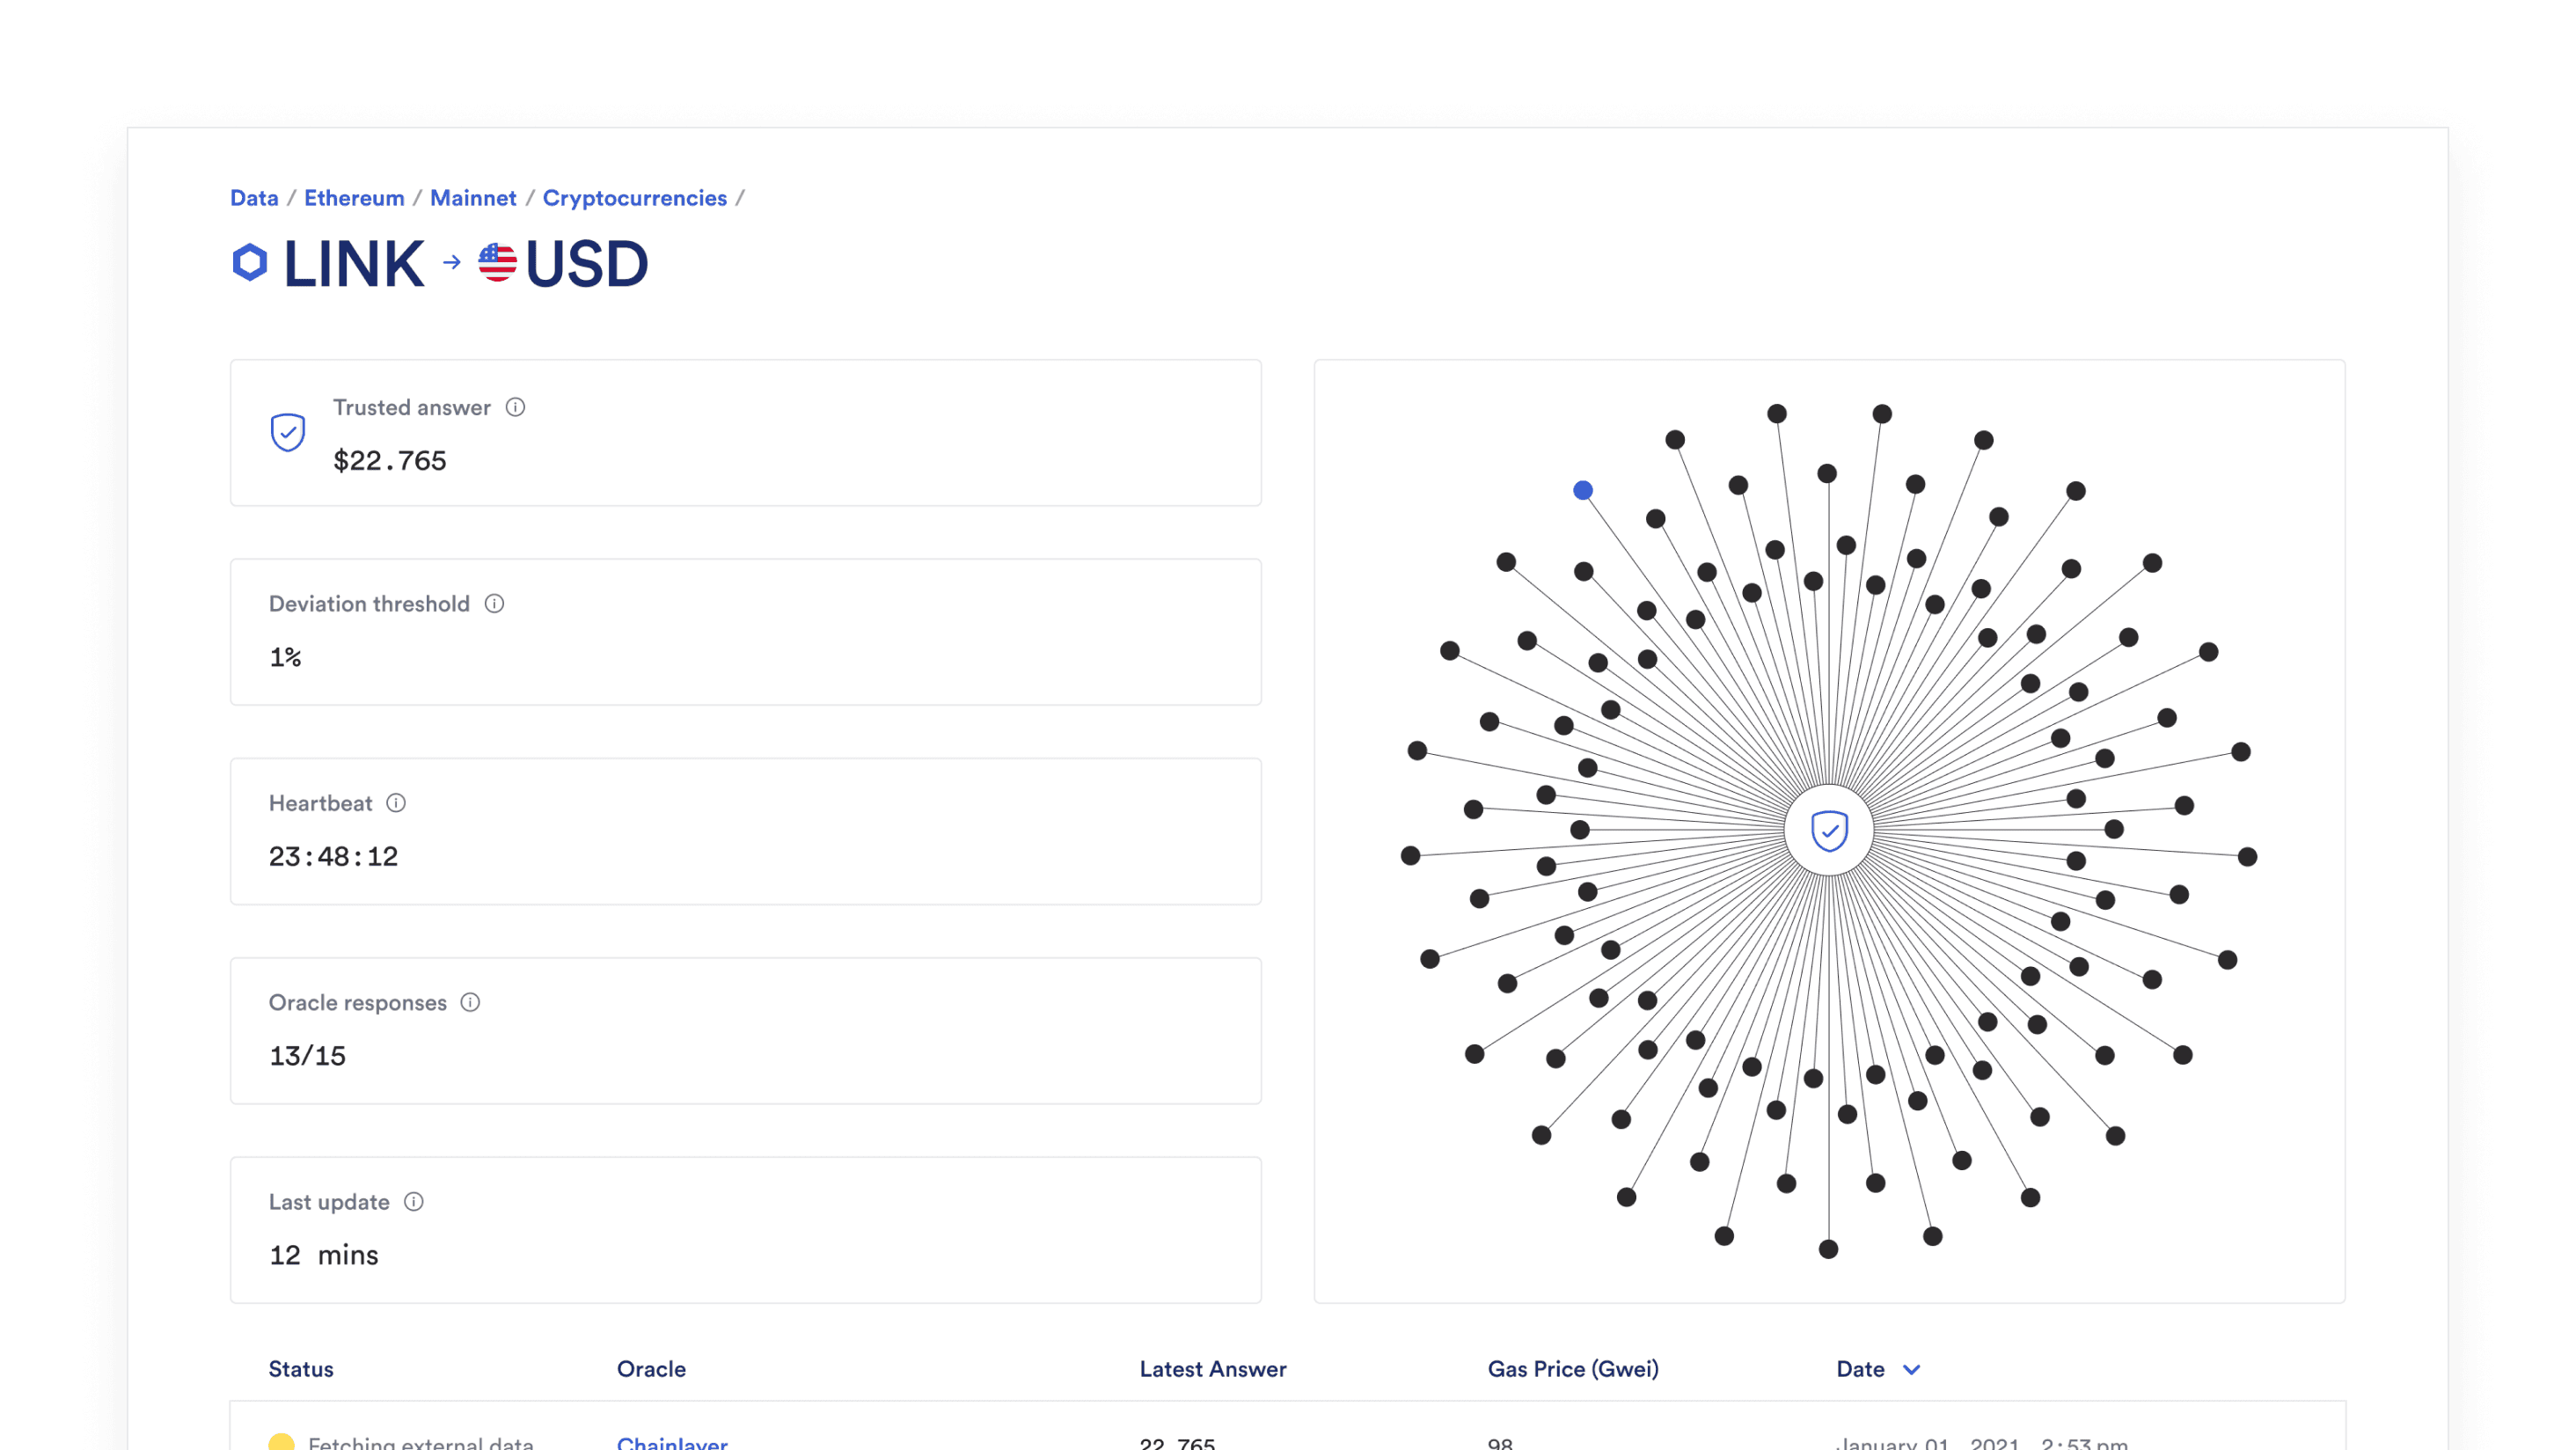
The existing interface had been built when there were a handful of feeds; now it had to support hundreds. Information hierarchy was unclear, dense technical data was difficult to parse, and developers couldn't easily assess oracle health, update recency, or reliability at a glance.
At the same time, the product lacked a cohesive system foundation. Essential components and patterns did not yet exist, and engineering needed a structured, reusable approach to support rapid ecosystem growth.
Solution
I approached the redesign as both a product initiative and a systems initiative — making Data Feeds clearer and more trustworthy while building the foundation Chainlink had not yet had.
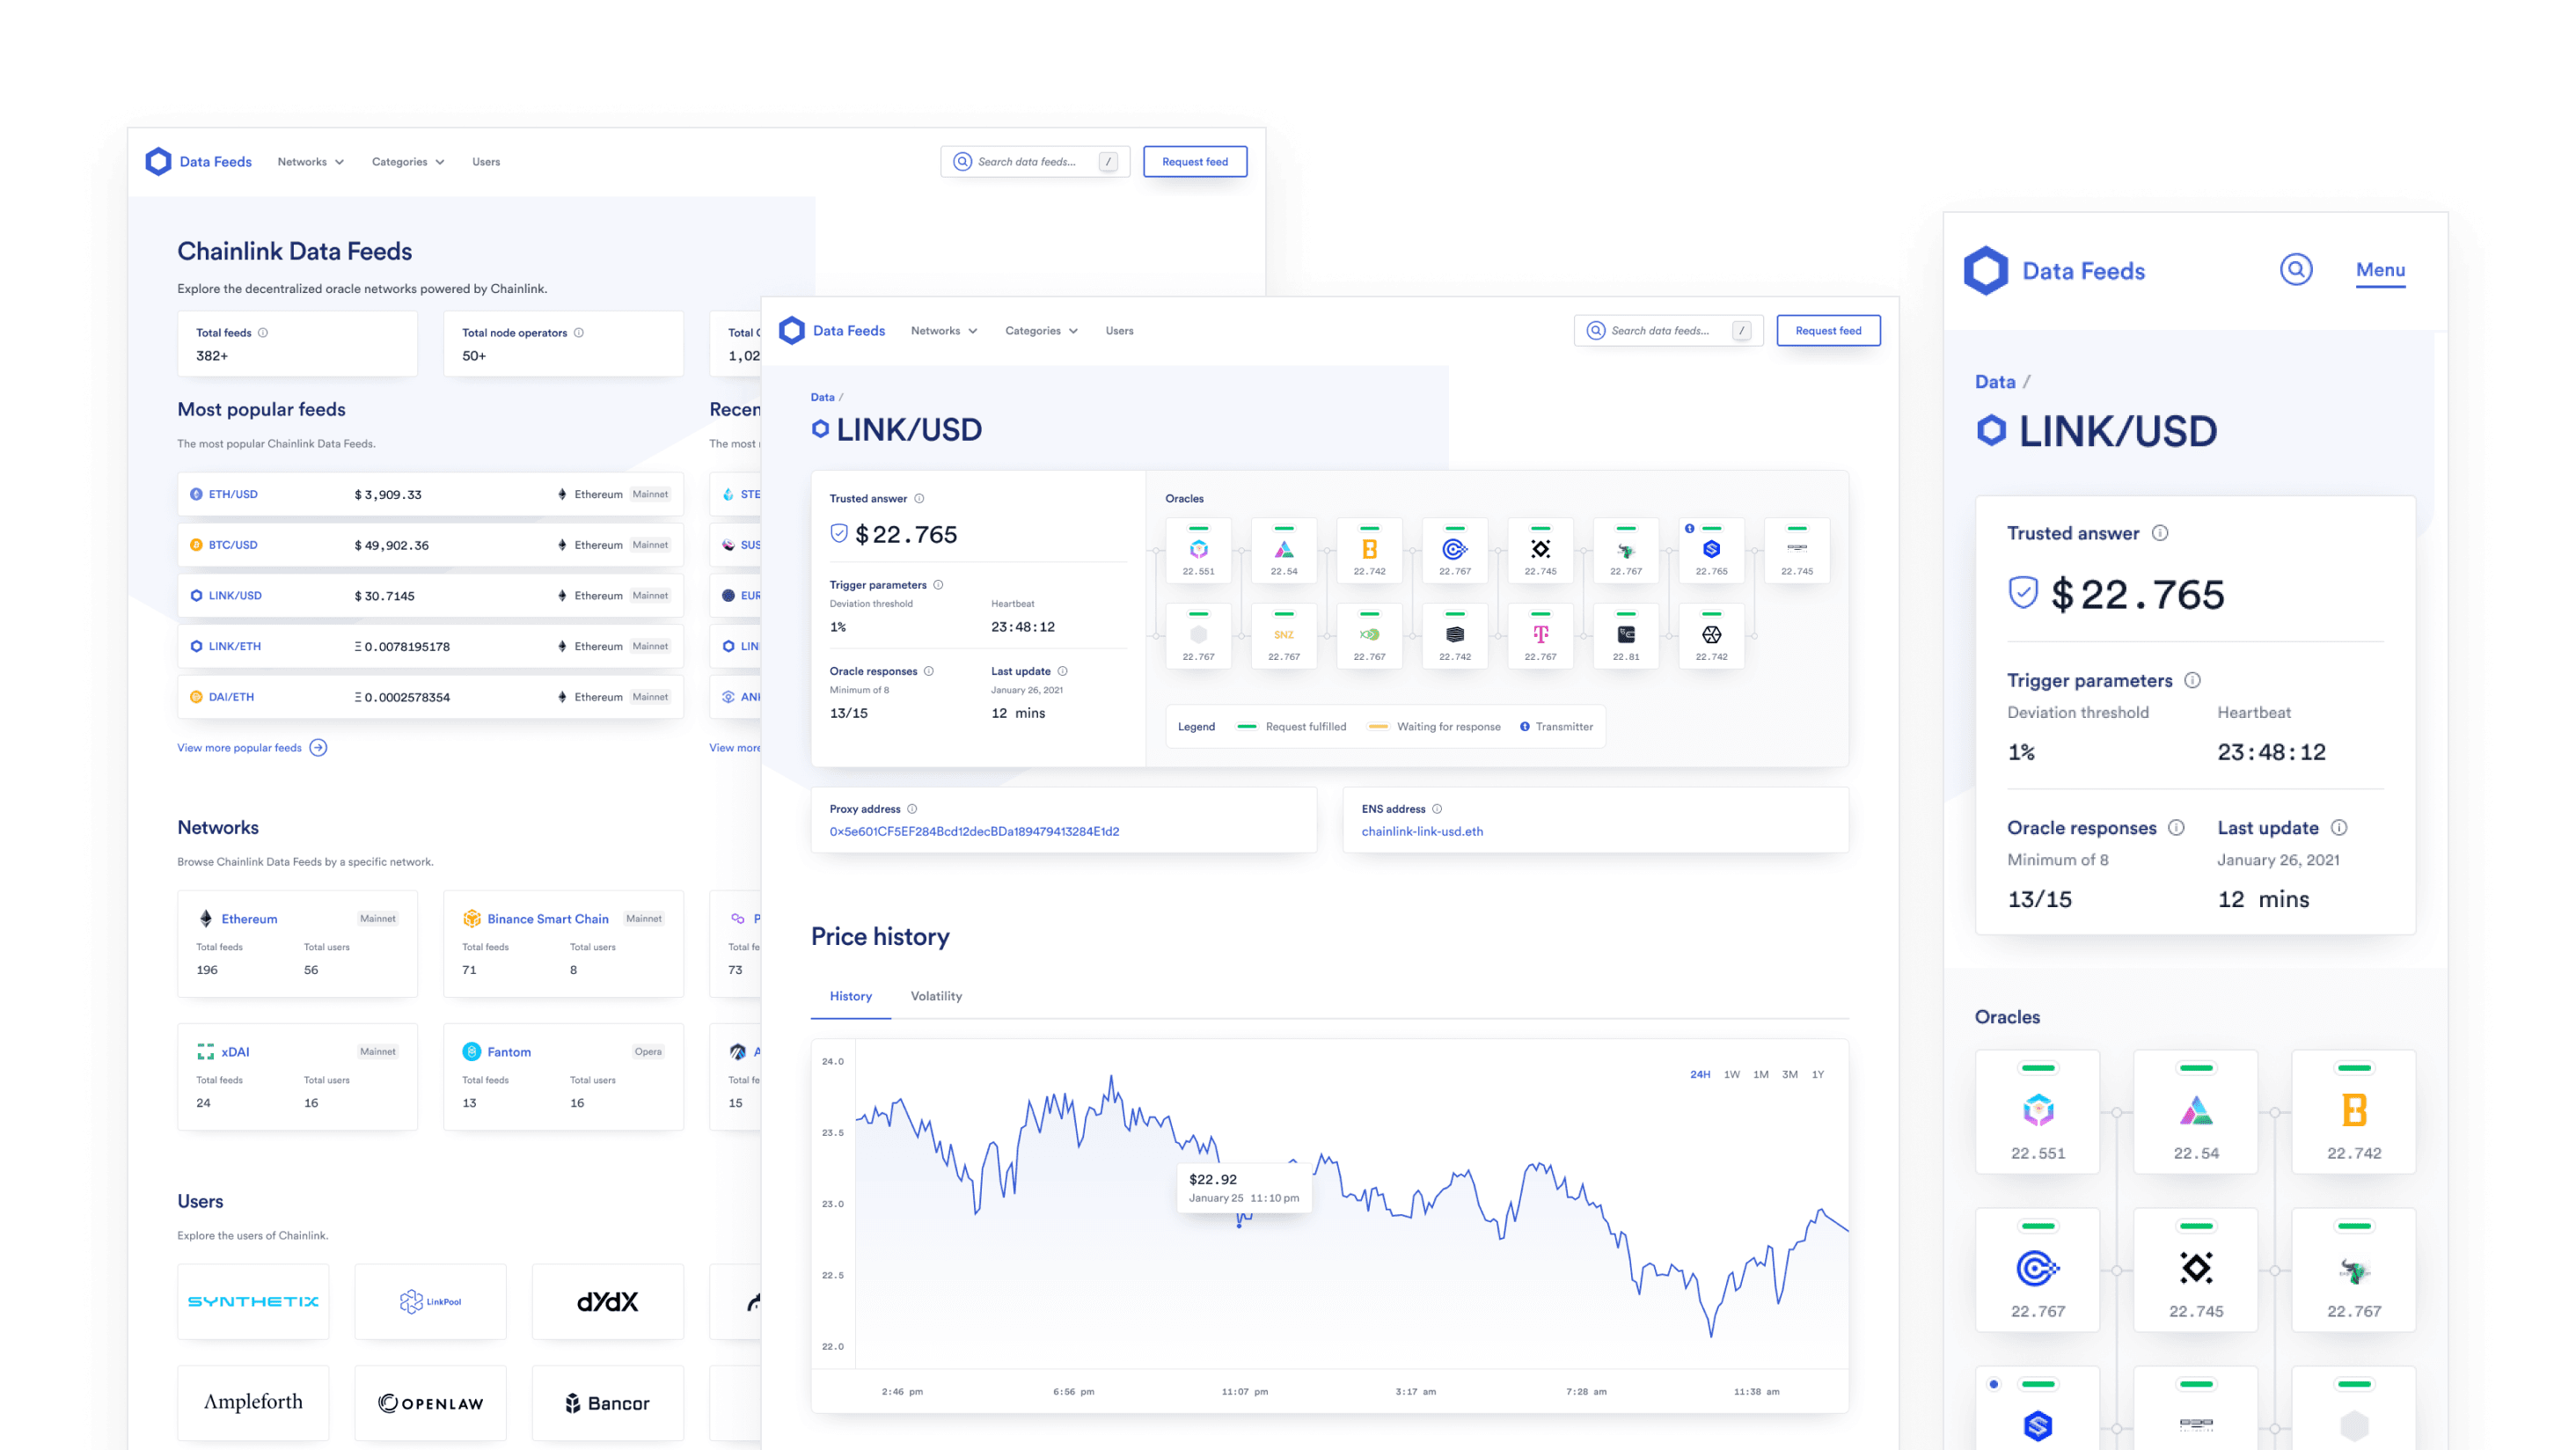
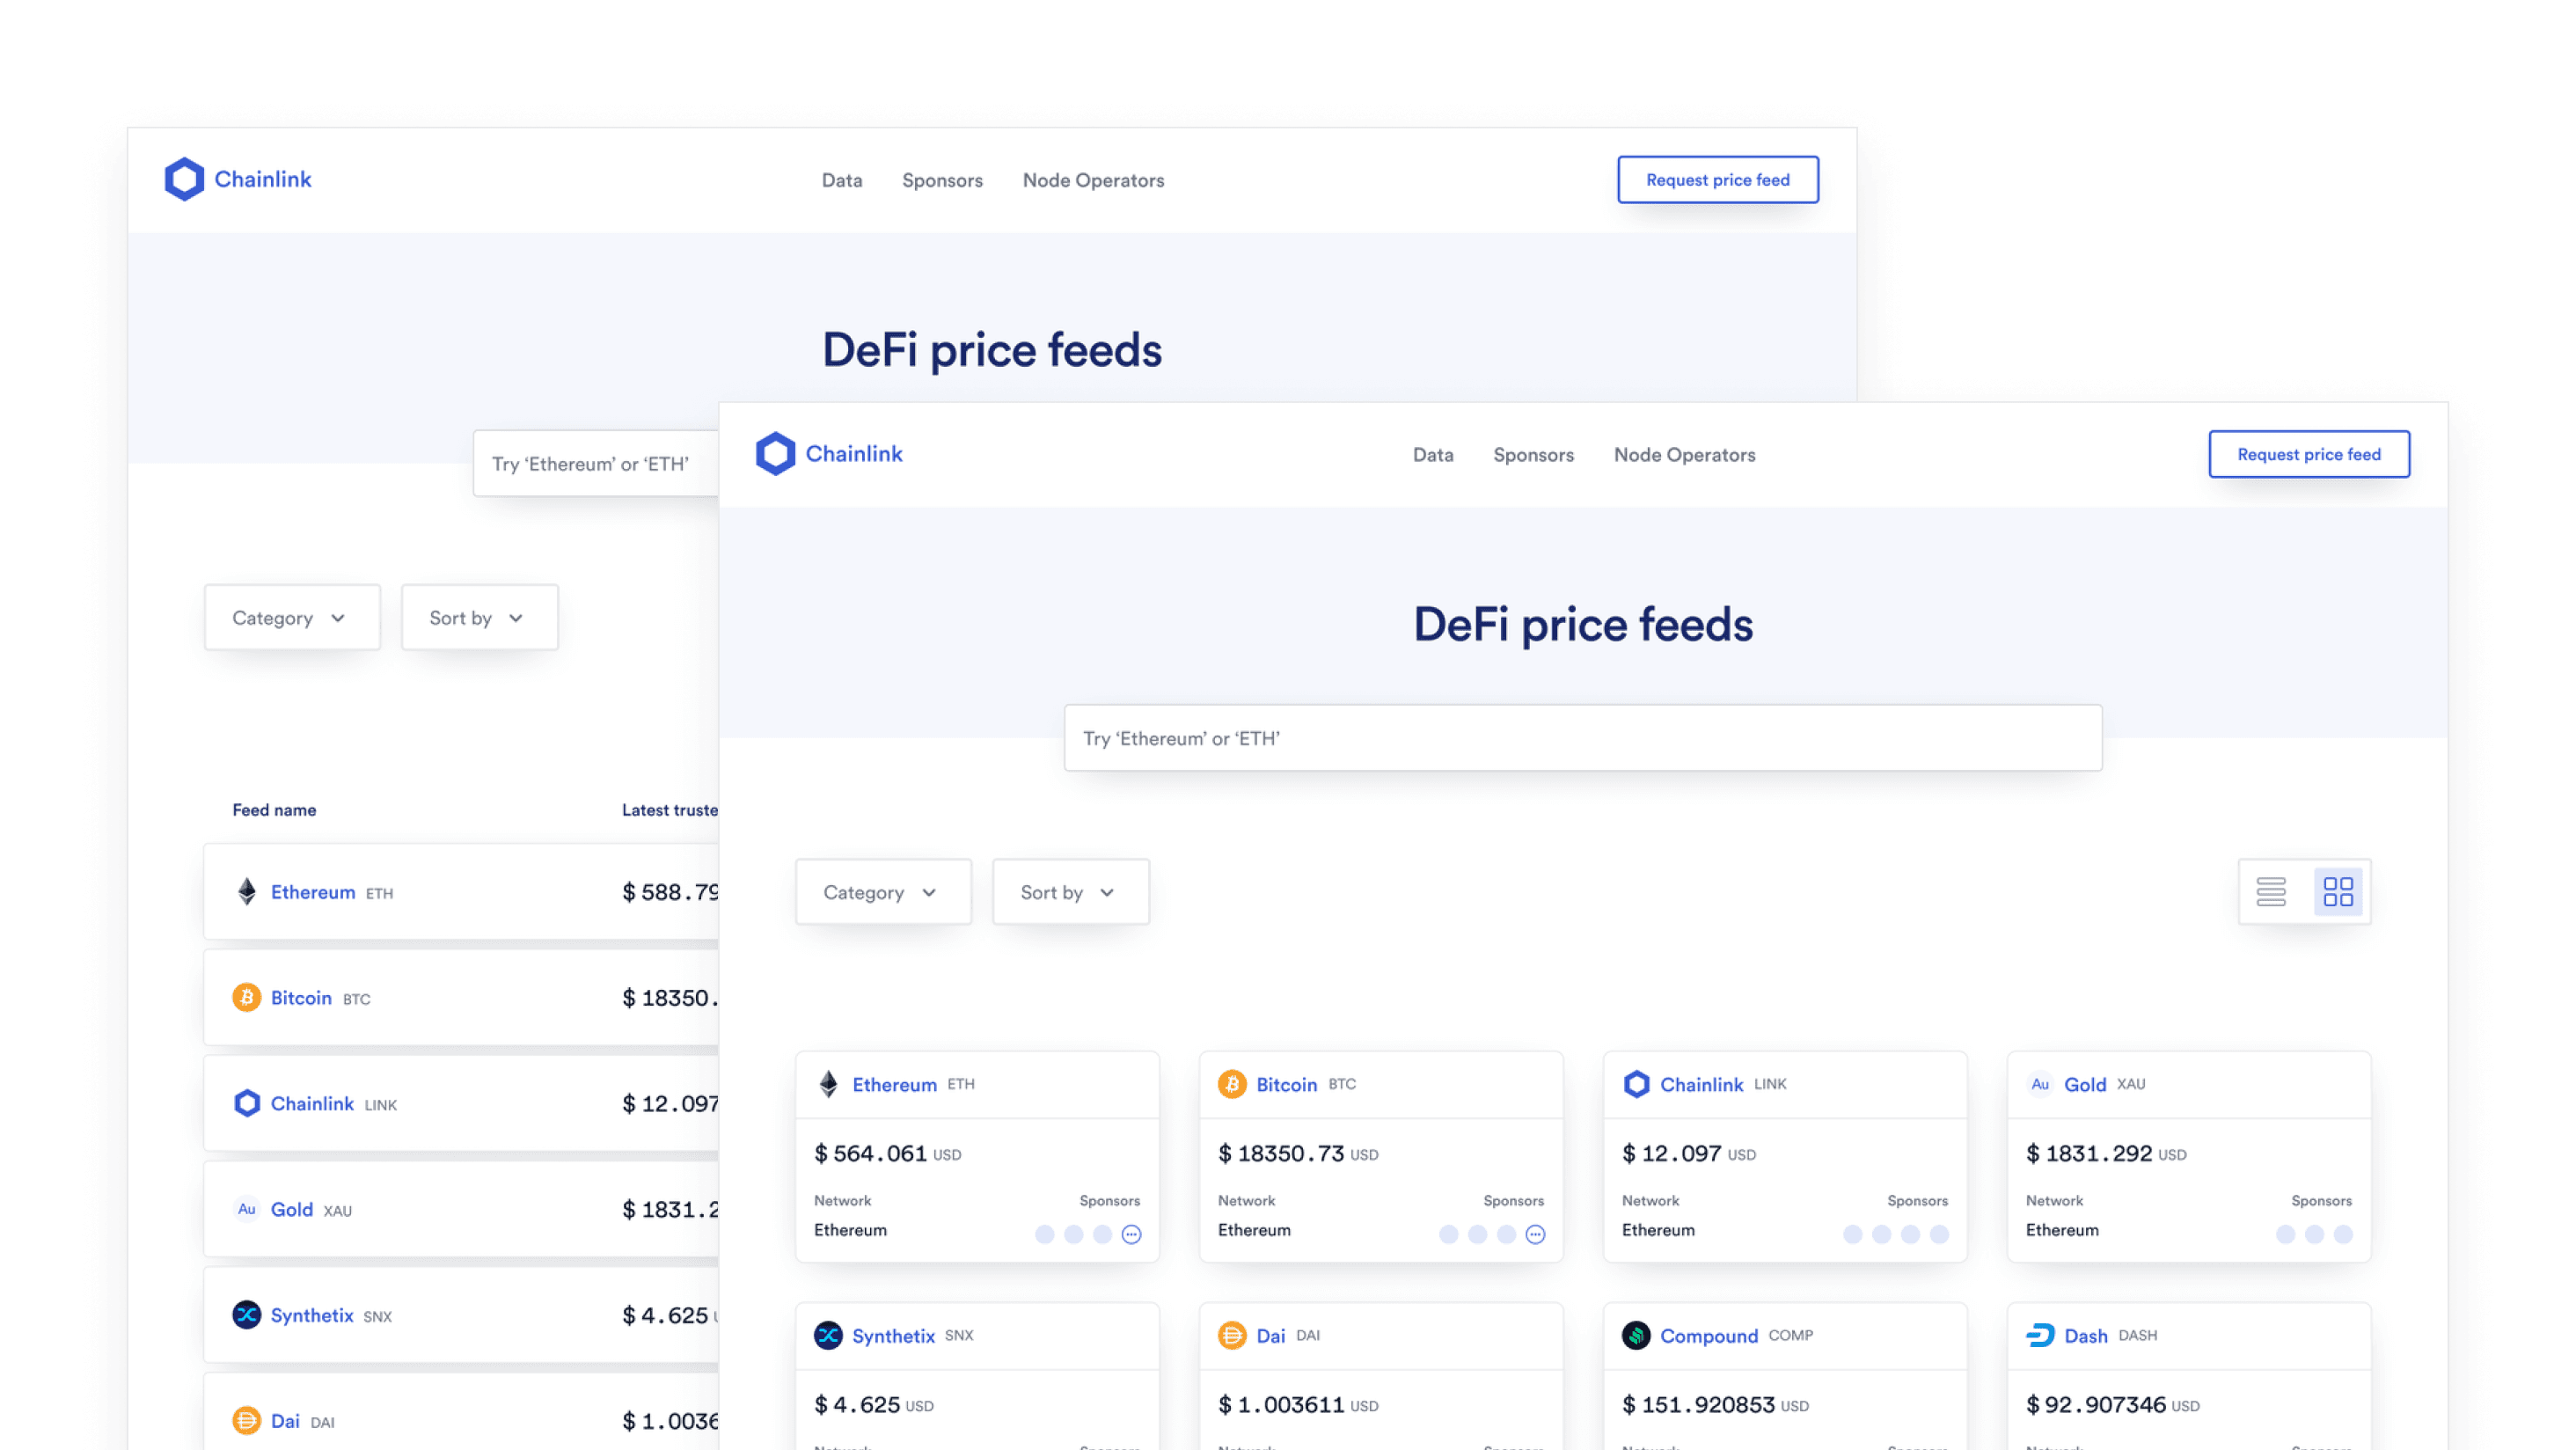
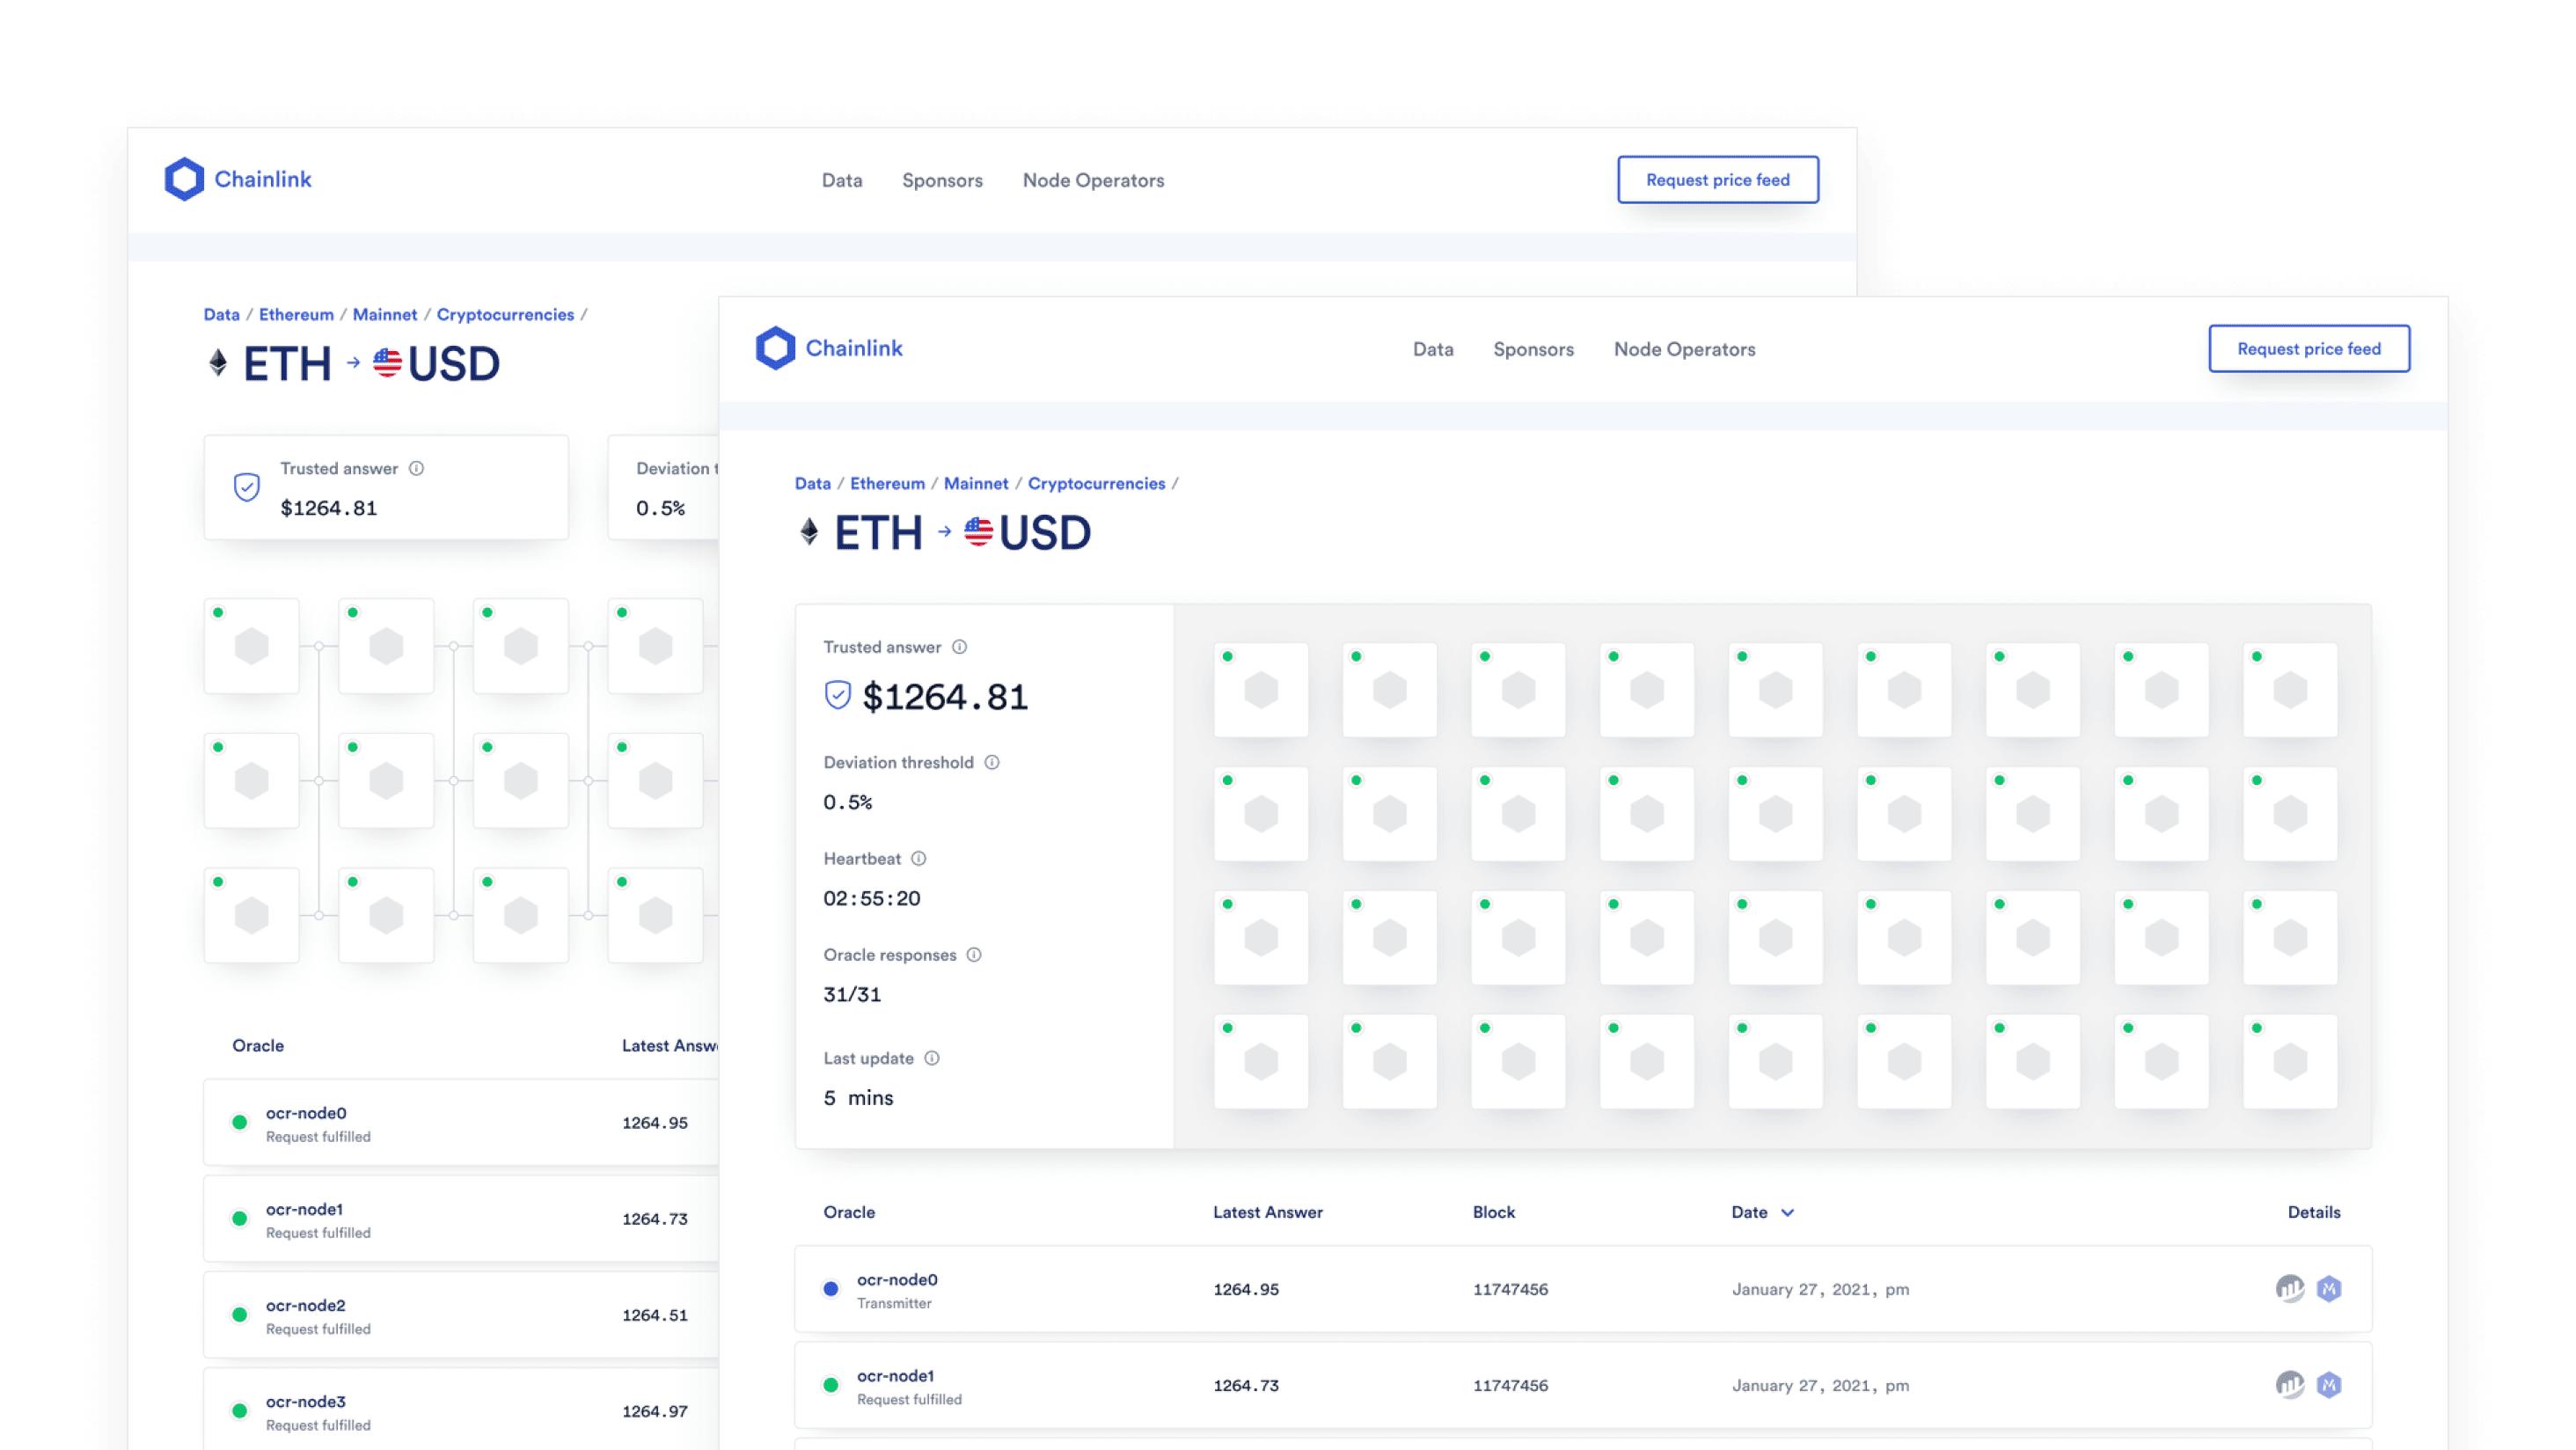
The most important strategic call was about hierarchy at scale. The original product used a radial visualization to map oracle inputs to a feed's trusted answer, with individual oracles radiating outward from the center. It worked when feeds had a handful of oracles, but as the network grew, the pattern broke down: labeling fell apart and the trust signal got harder to read. I replaced it with a tabular pattern that could scale to any number of oracles. The shift came with a parallel decision: where the old interface gave every data point the same visual weight, the redesign made the trusted answer the visual center. For developers and exchanges using Data Feeds, the answer was the answer; everything else was supporting context.
Creating a scalable information hierarchy
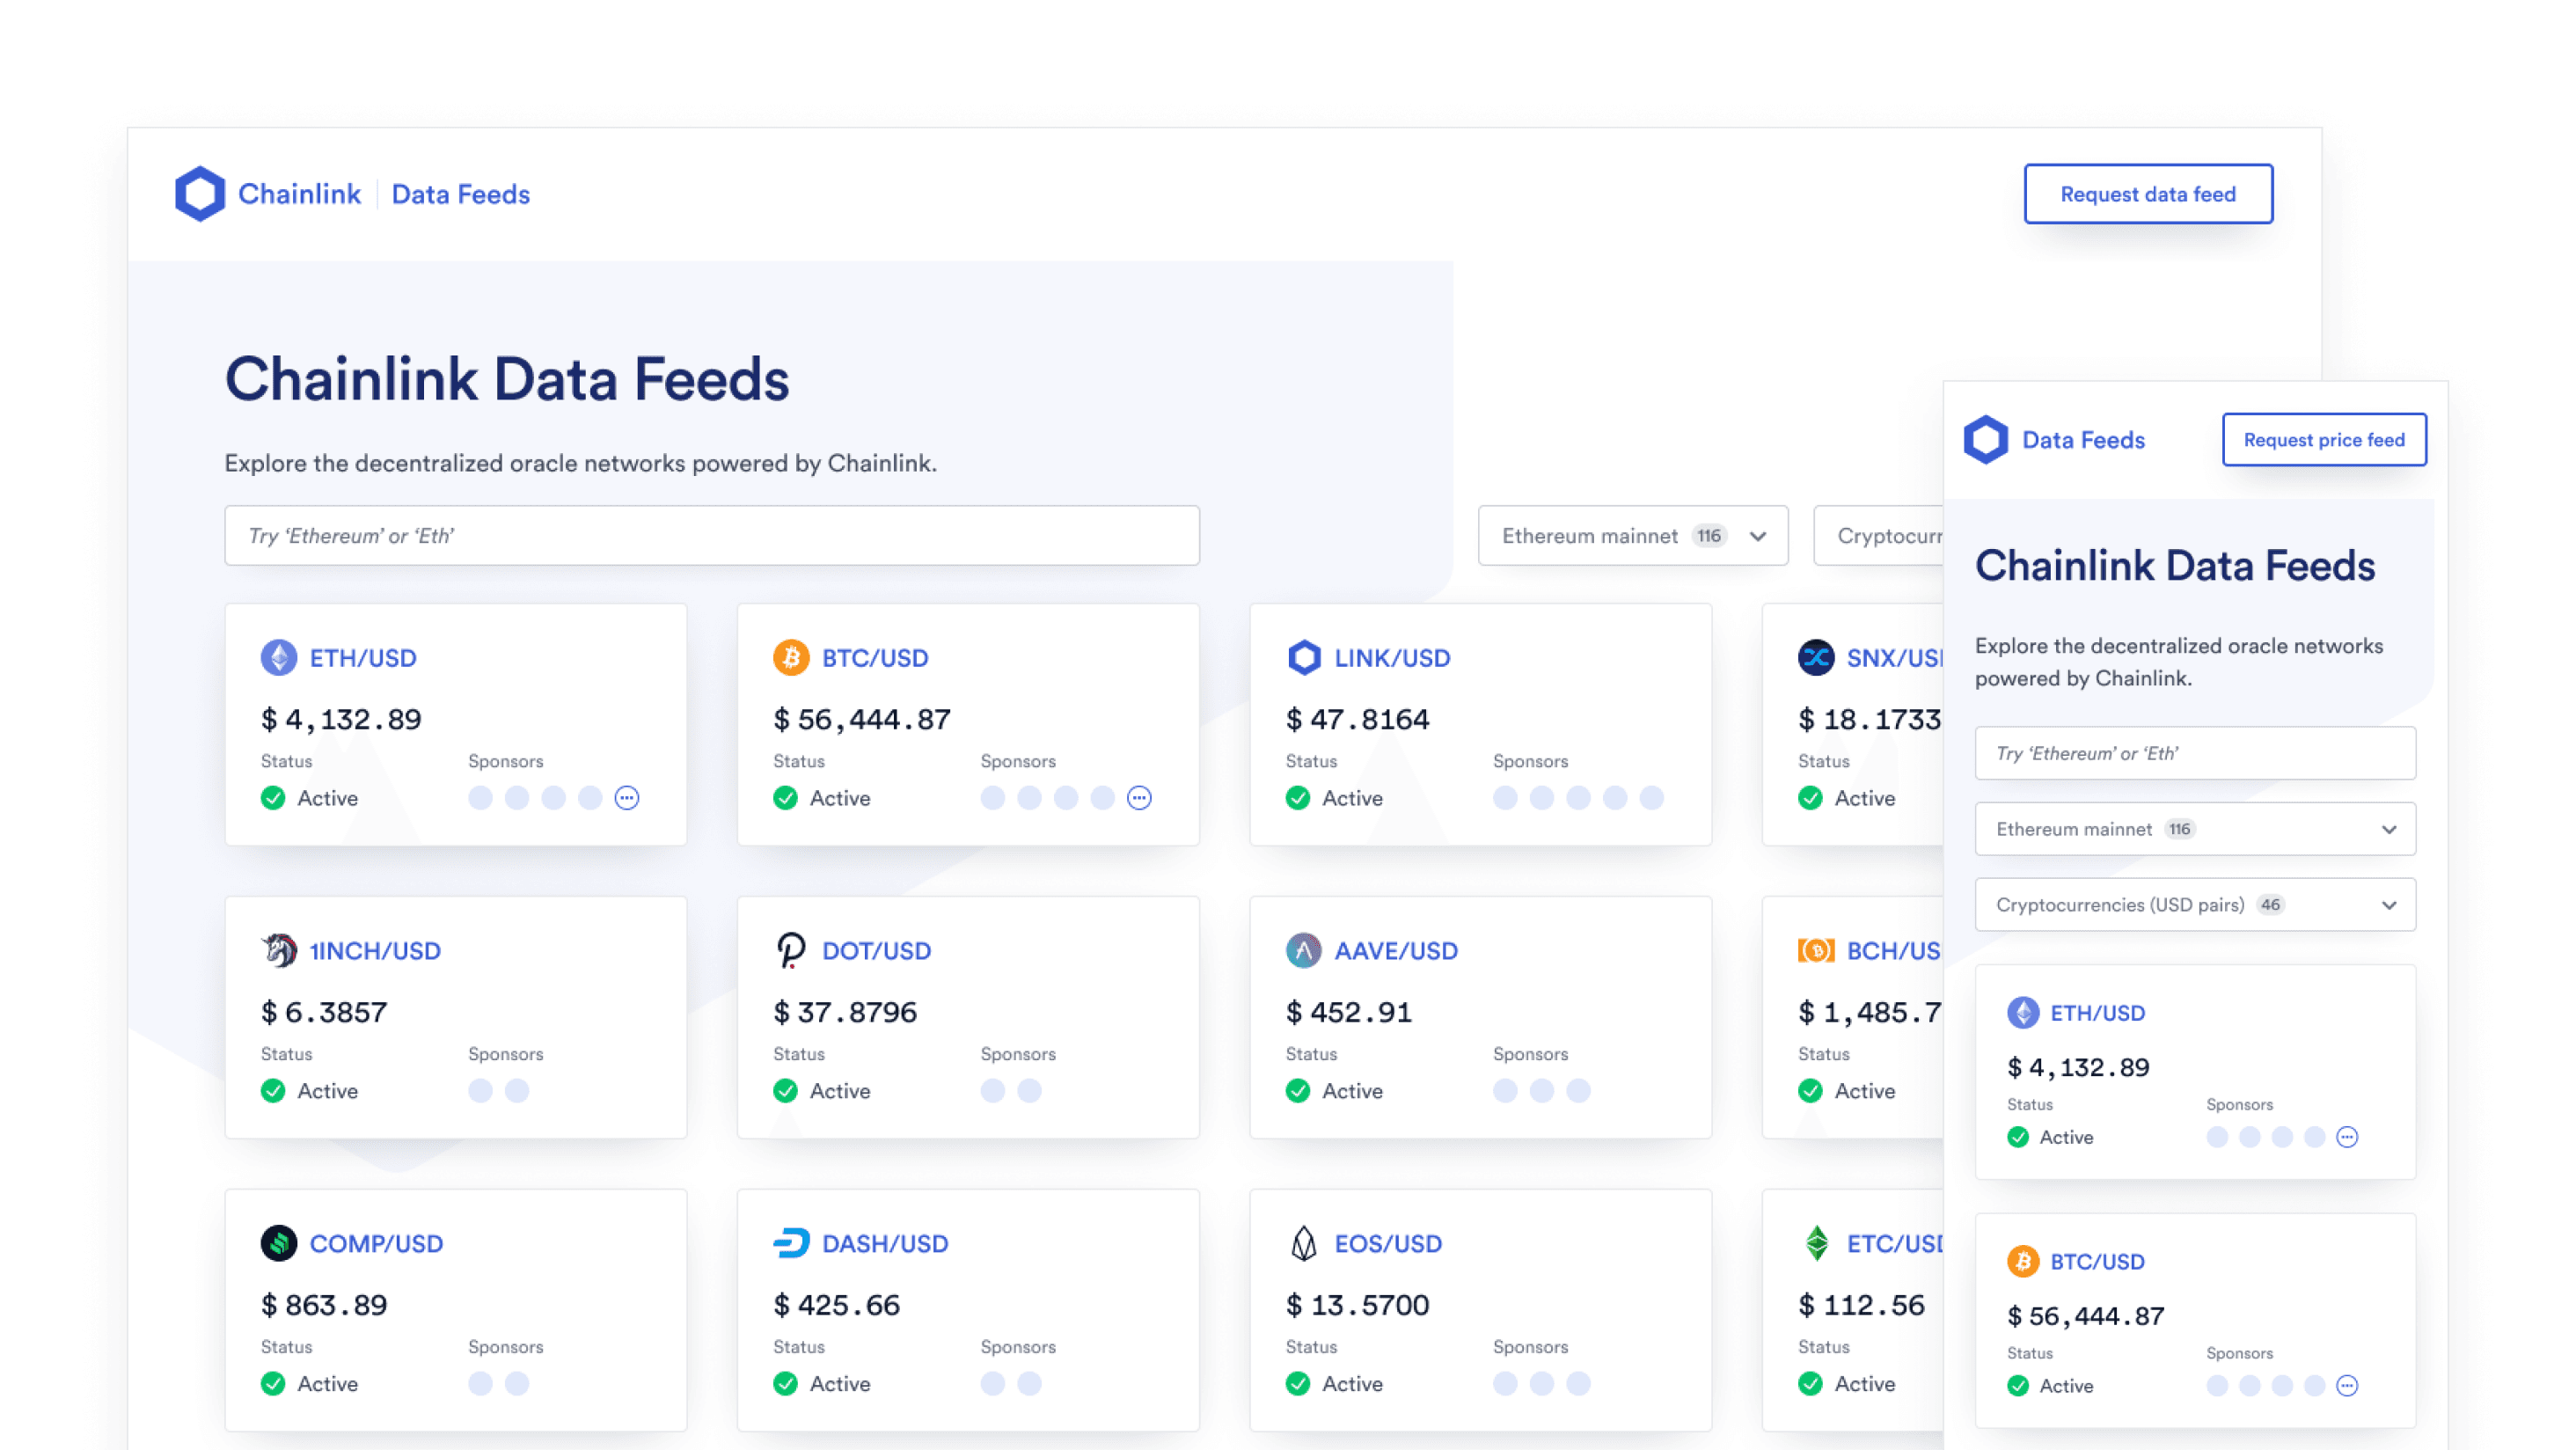
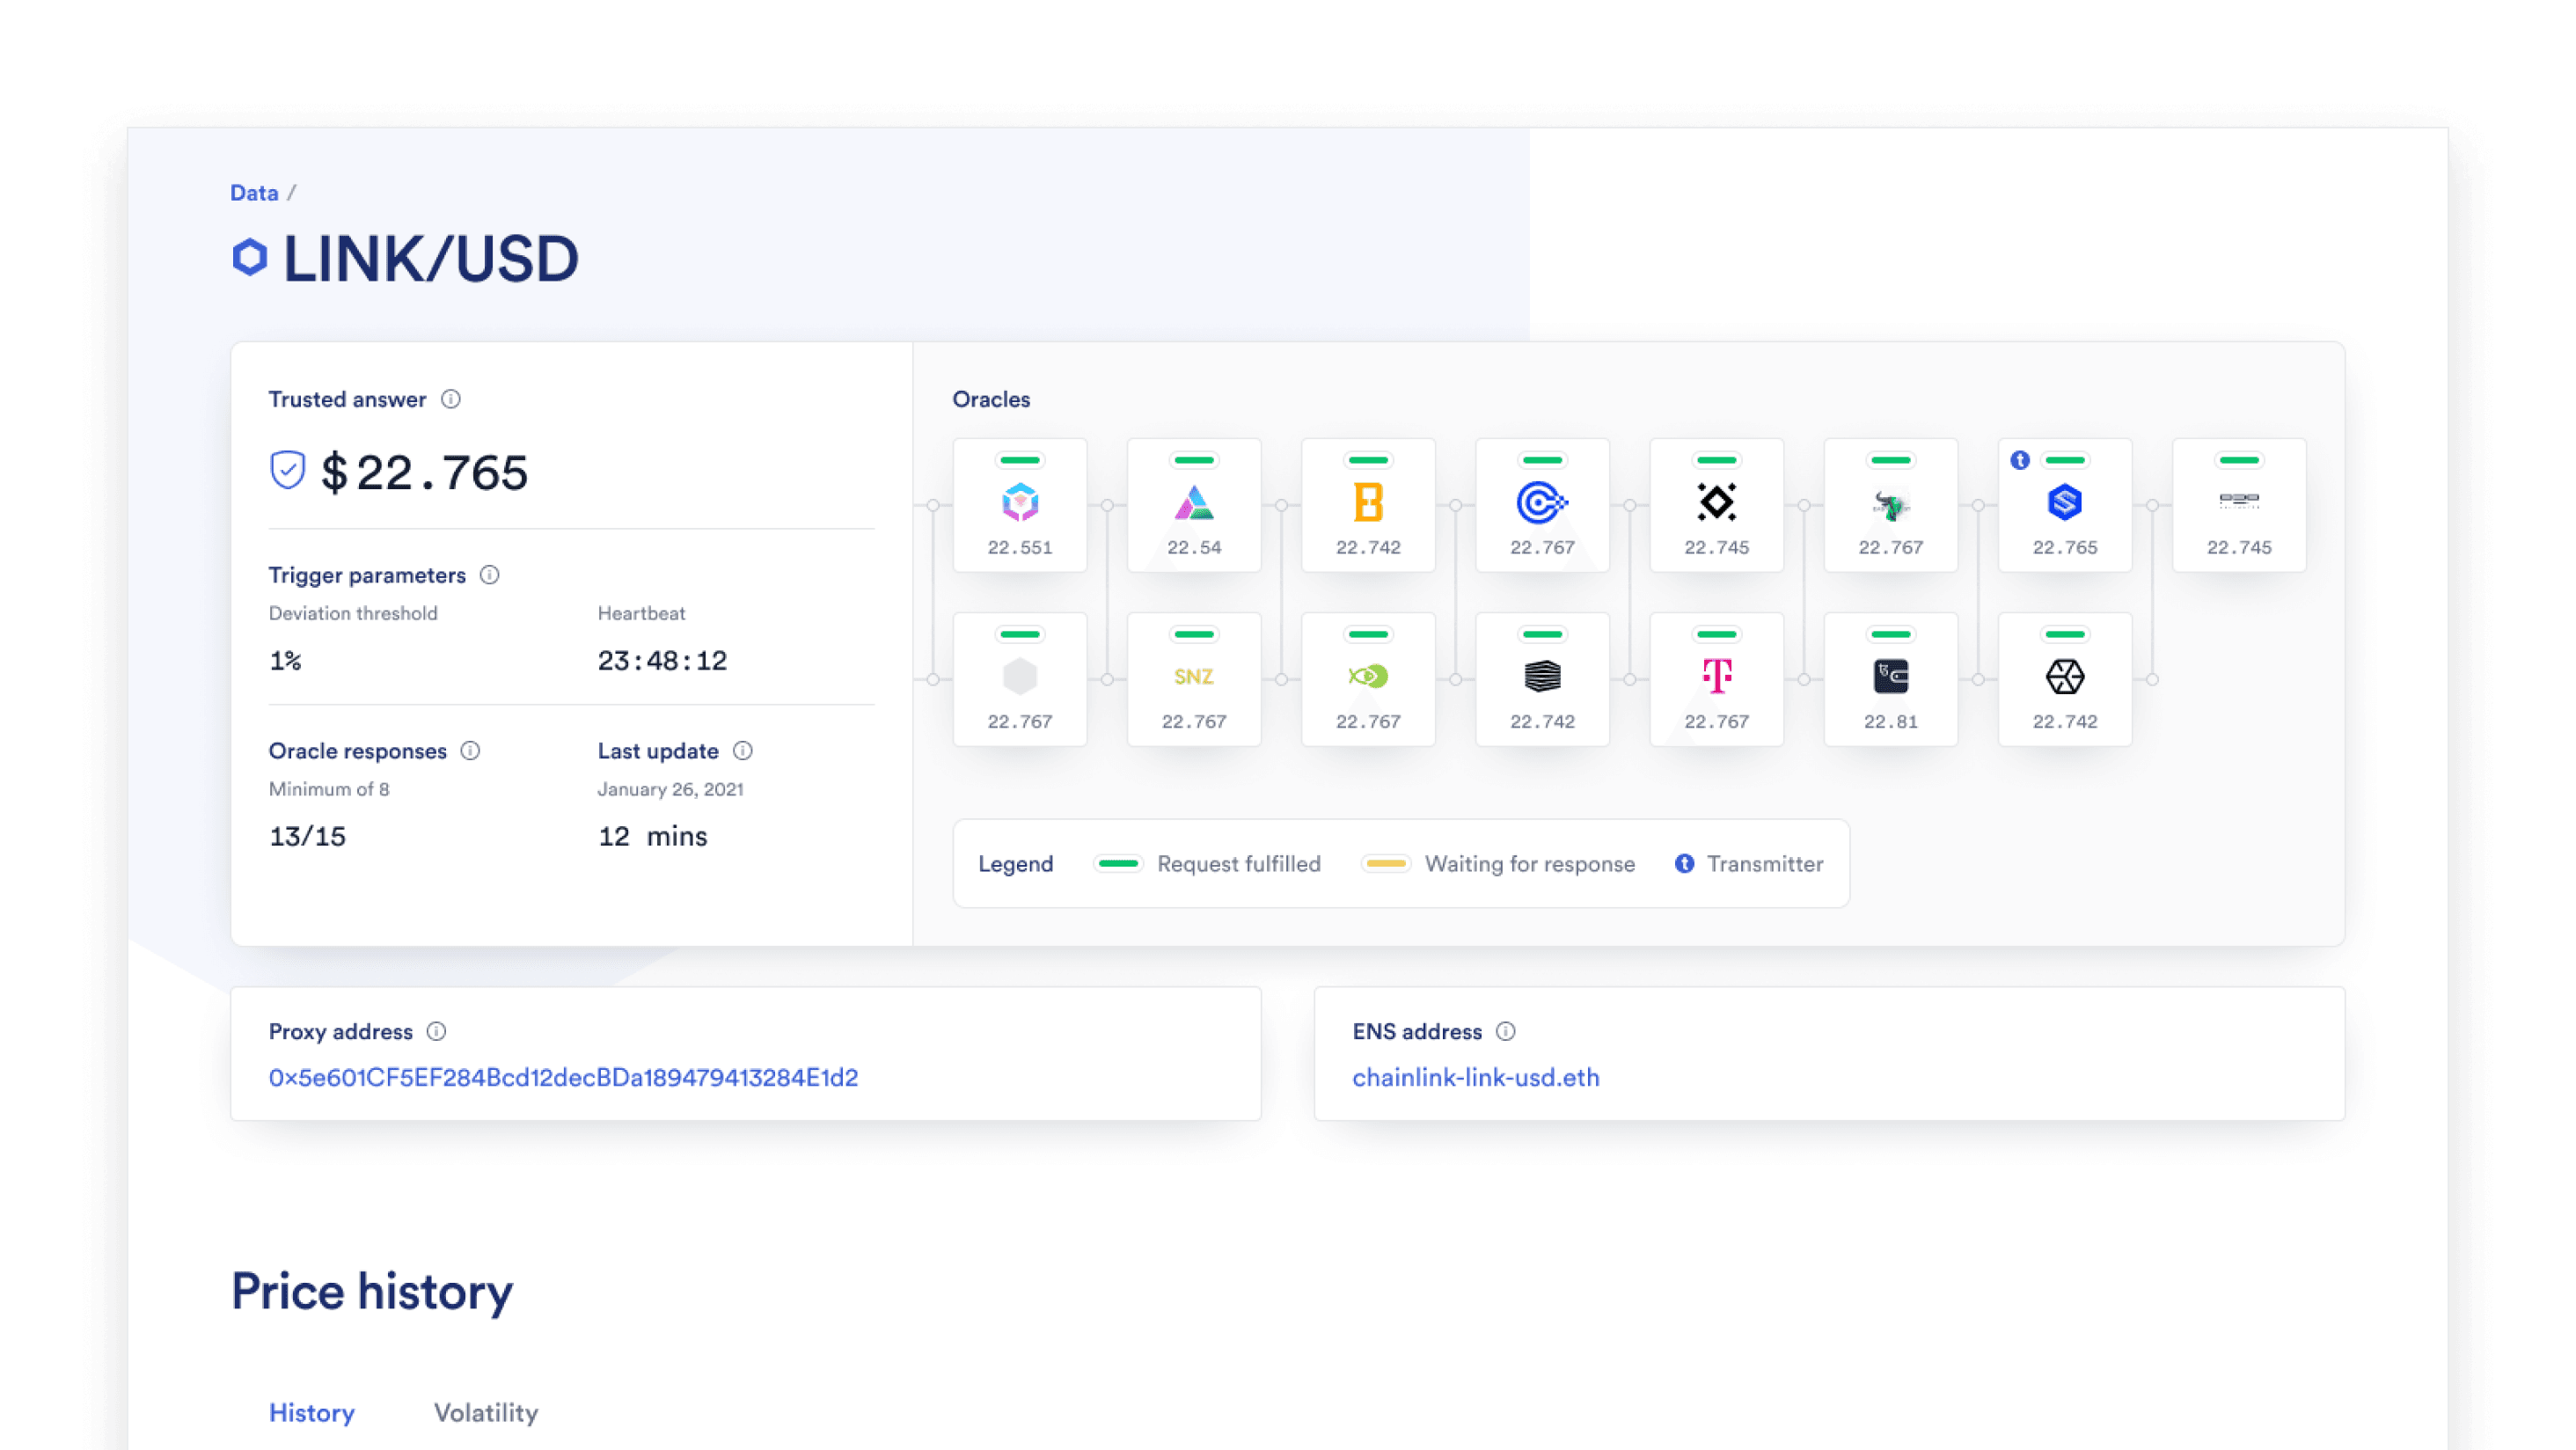
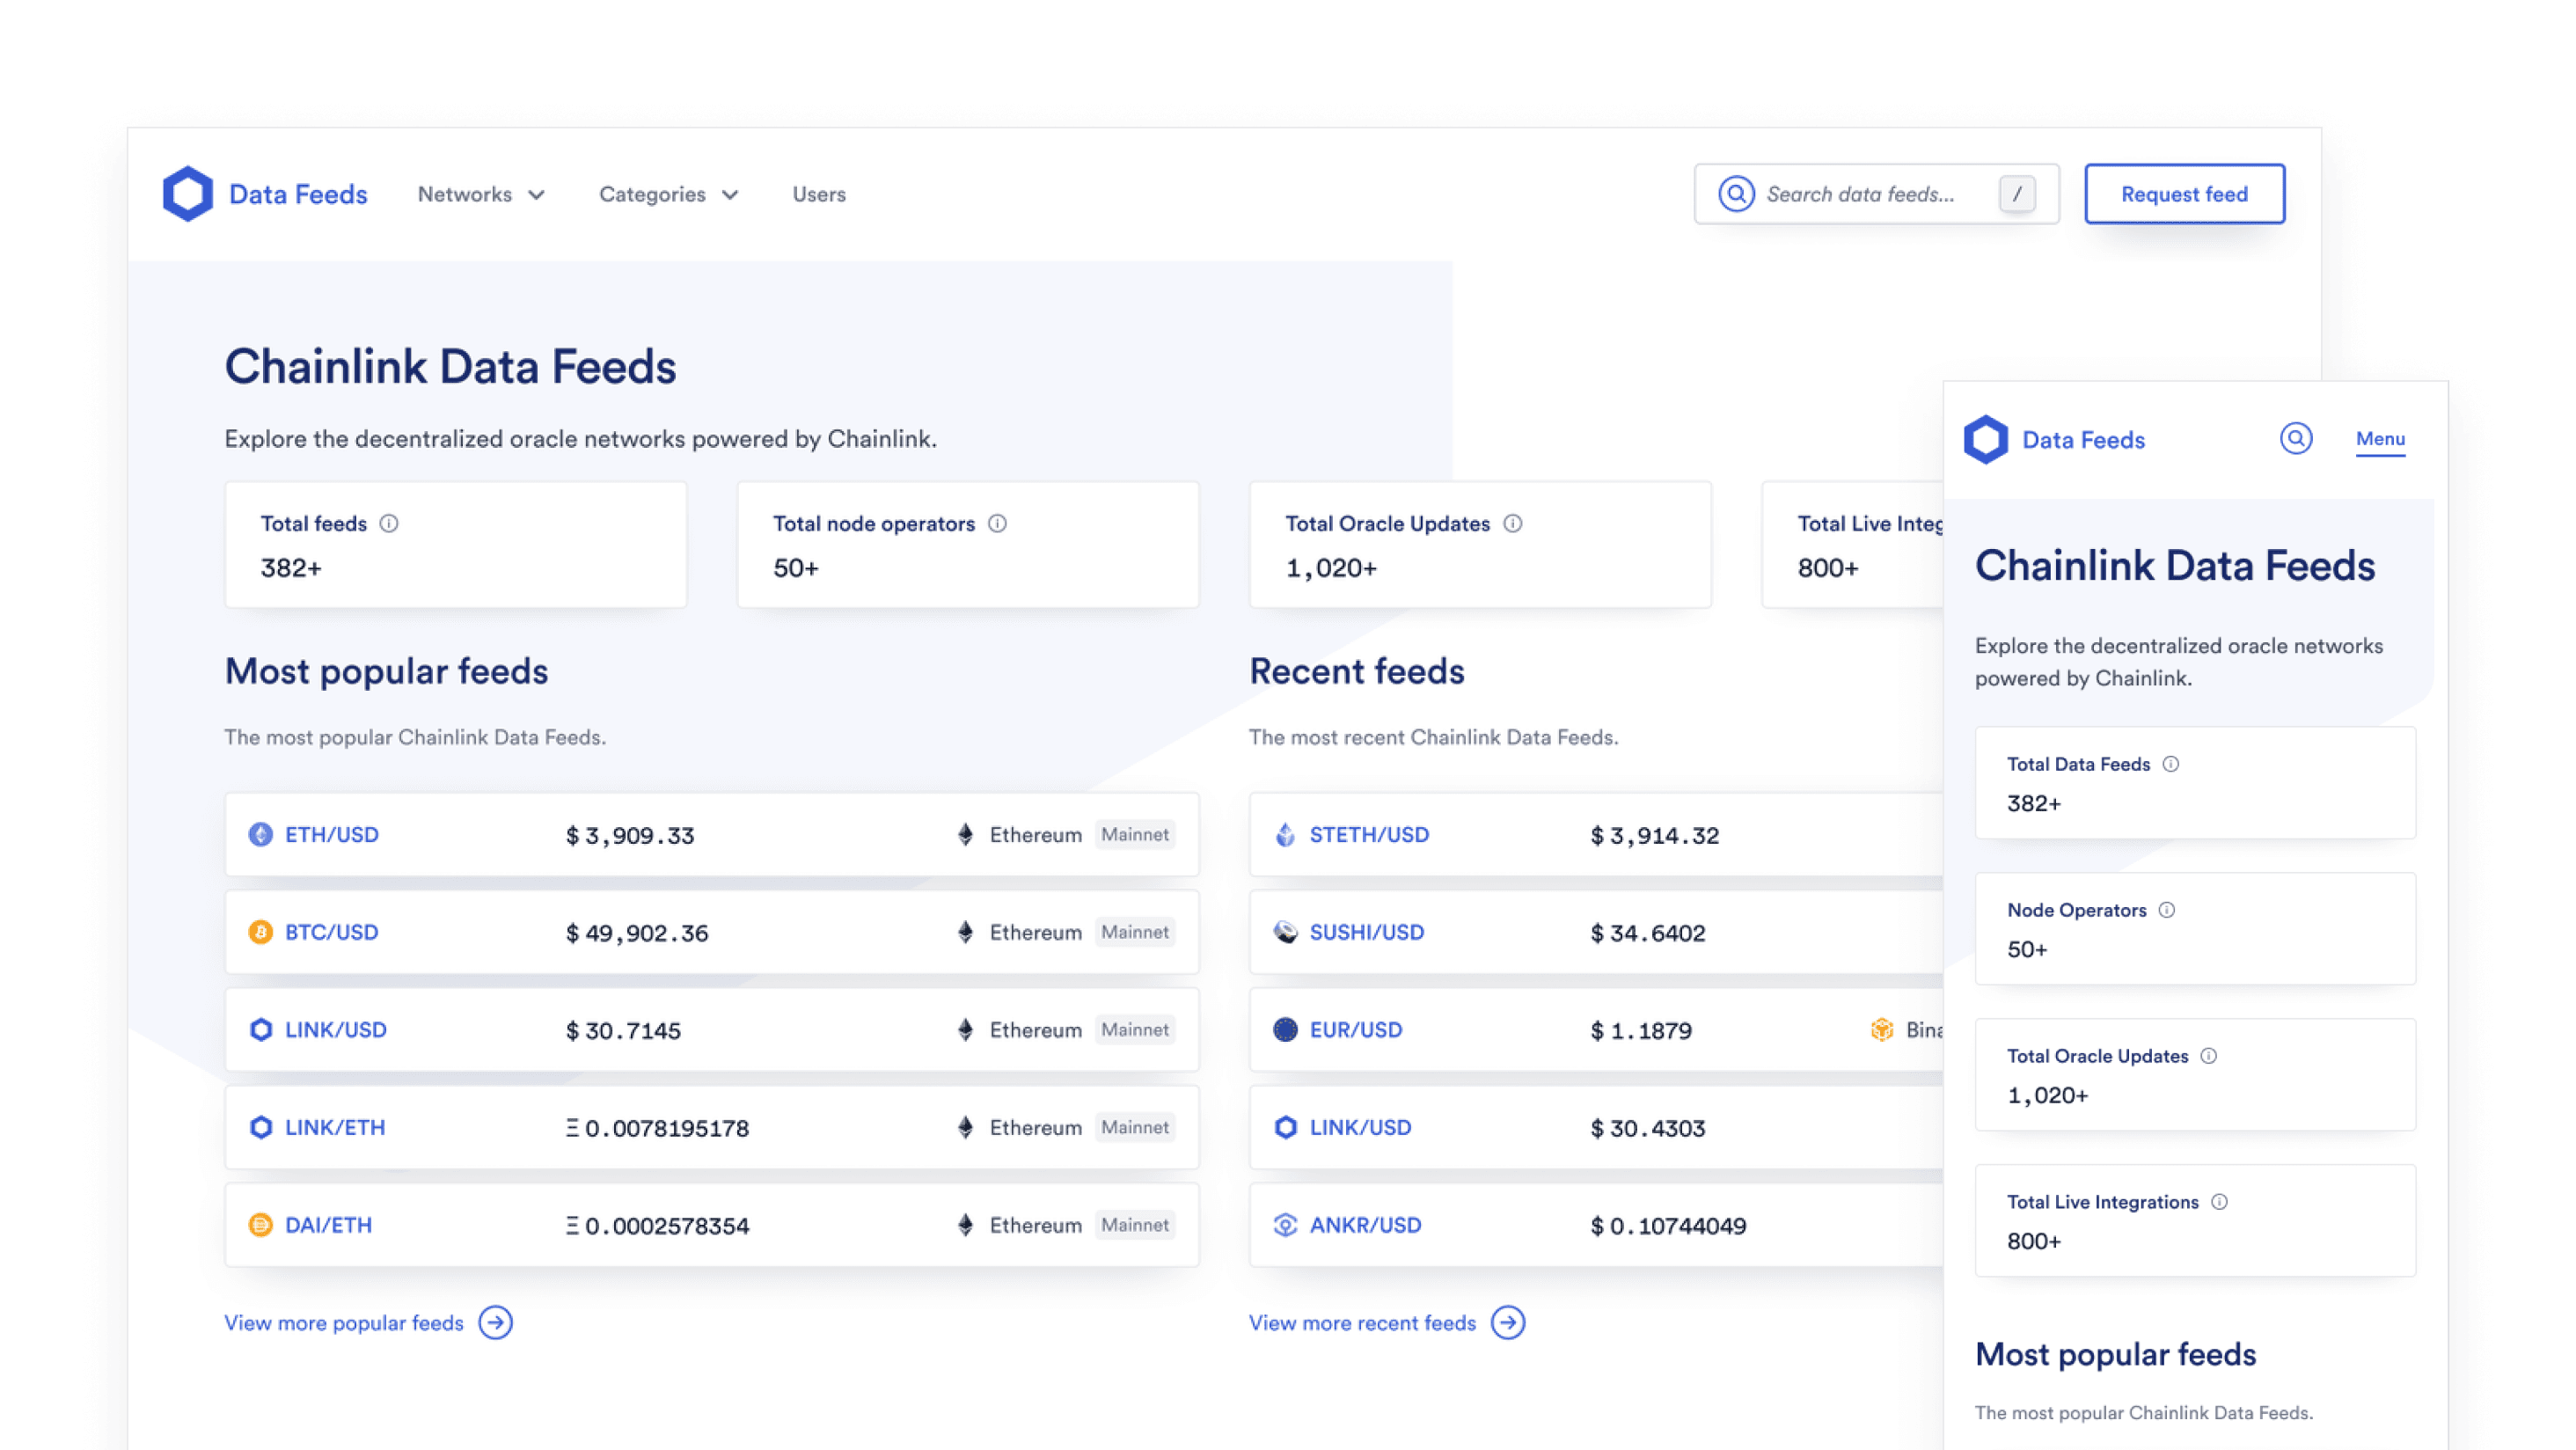
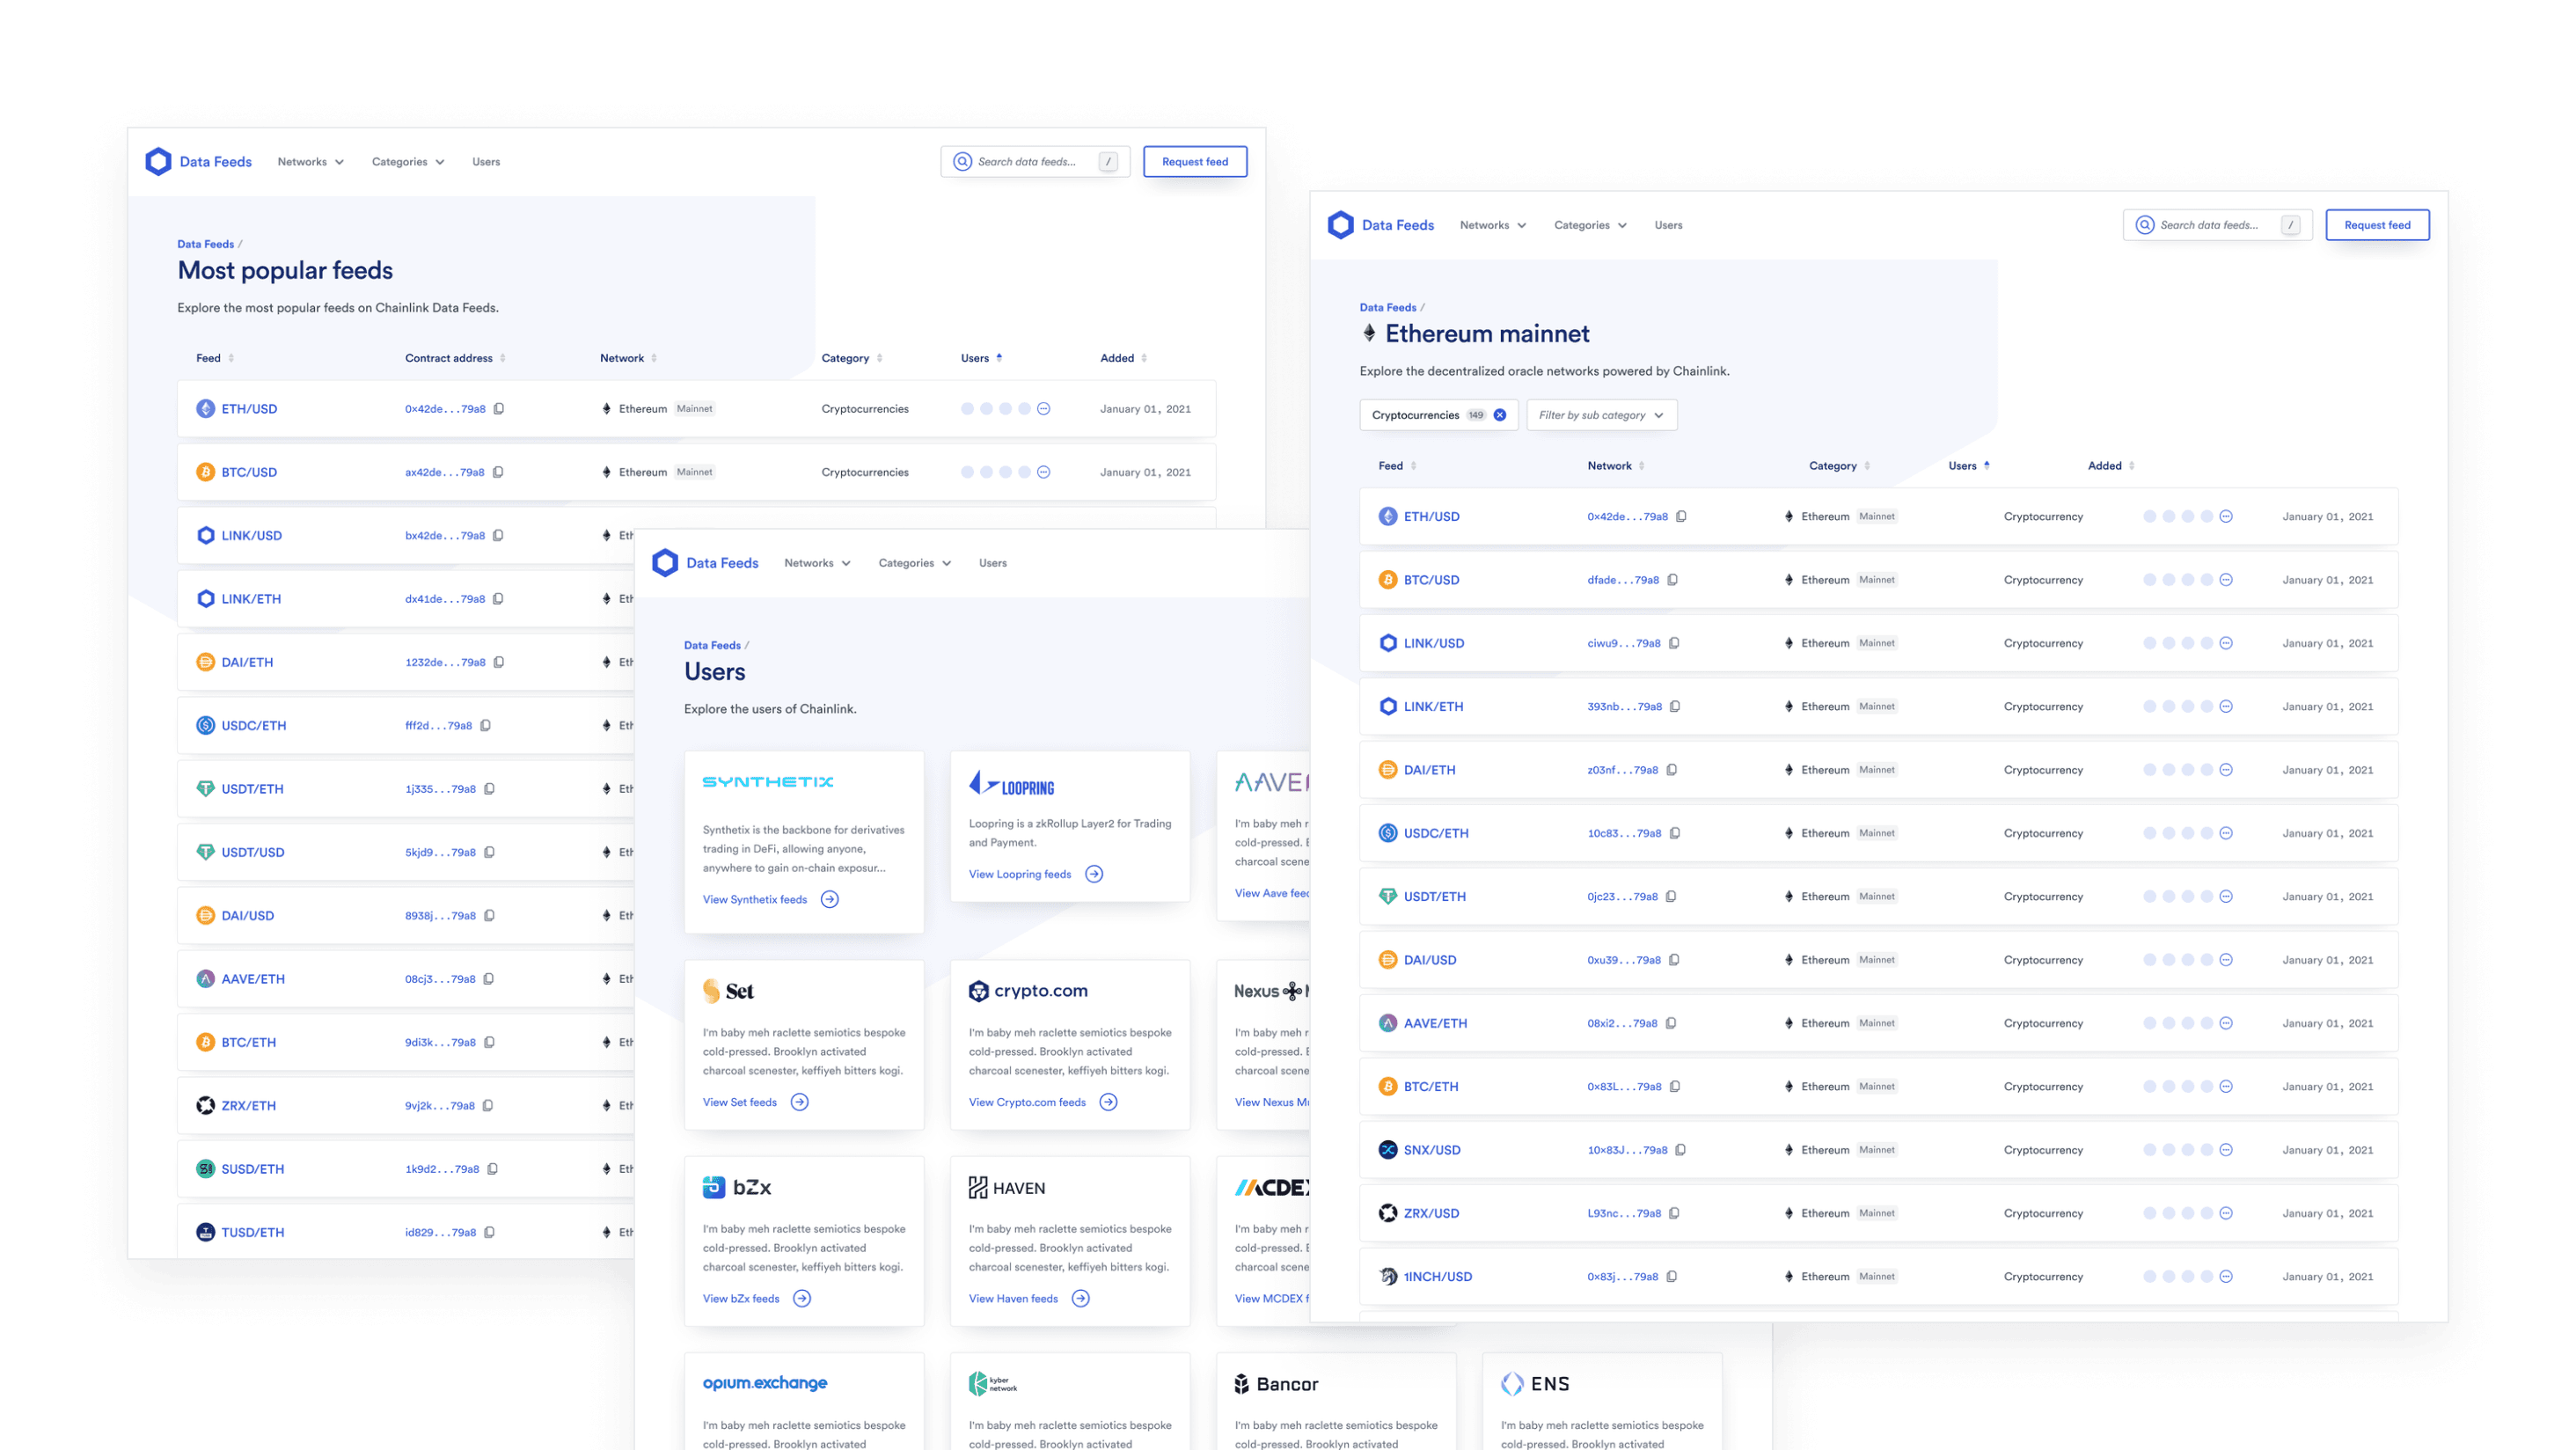
I restructured feed detail pages to surface the most critical information first: aggregated price, supported networks, risk parameters, and last update time. The layout had to scale across thousands of feeds spanning crypto, equities, commodities, fiat currencies, and stablecoins while staying readable across devices.
Designing for trust and transparency
Because these feeds powered exchanges and DeFi protocols, developers needed to validate them quickly and confidently. I expanded detail pages with structured data tables, historical charts, clearly labeled contract addresses, and explicit status indicators for node health and response freshness. These were the kind of details that let a developer assess whether a feed was safe to depend on.
Aligning with the refreshed brand
I worked closely with Chainlink's brand designers to bring the company's updated visual language into the product. We had recently completed the chain.link website redesign, and I carried foundational decisions from that work into Data Feeds. Modernizing typography, layout patterns, and interface styling helped the product feel cohesive with the marketing surfaces. The result positioned Data Feeds as a maintained, production-grade system rather than an internal tool that had outgrown itself.
Building a reusable product foundation
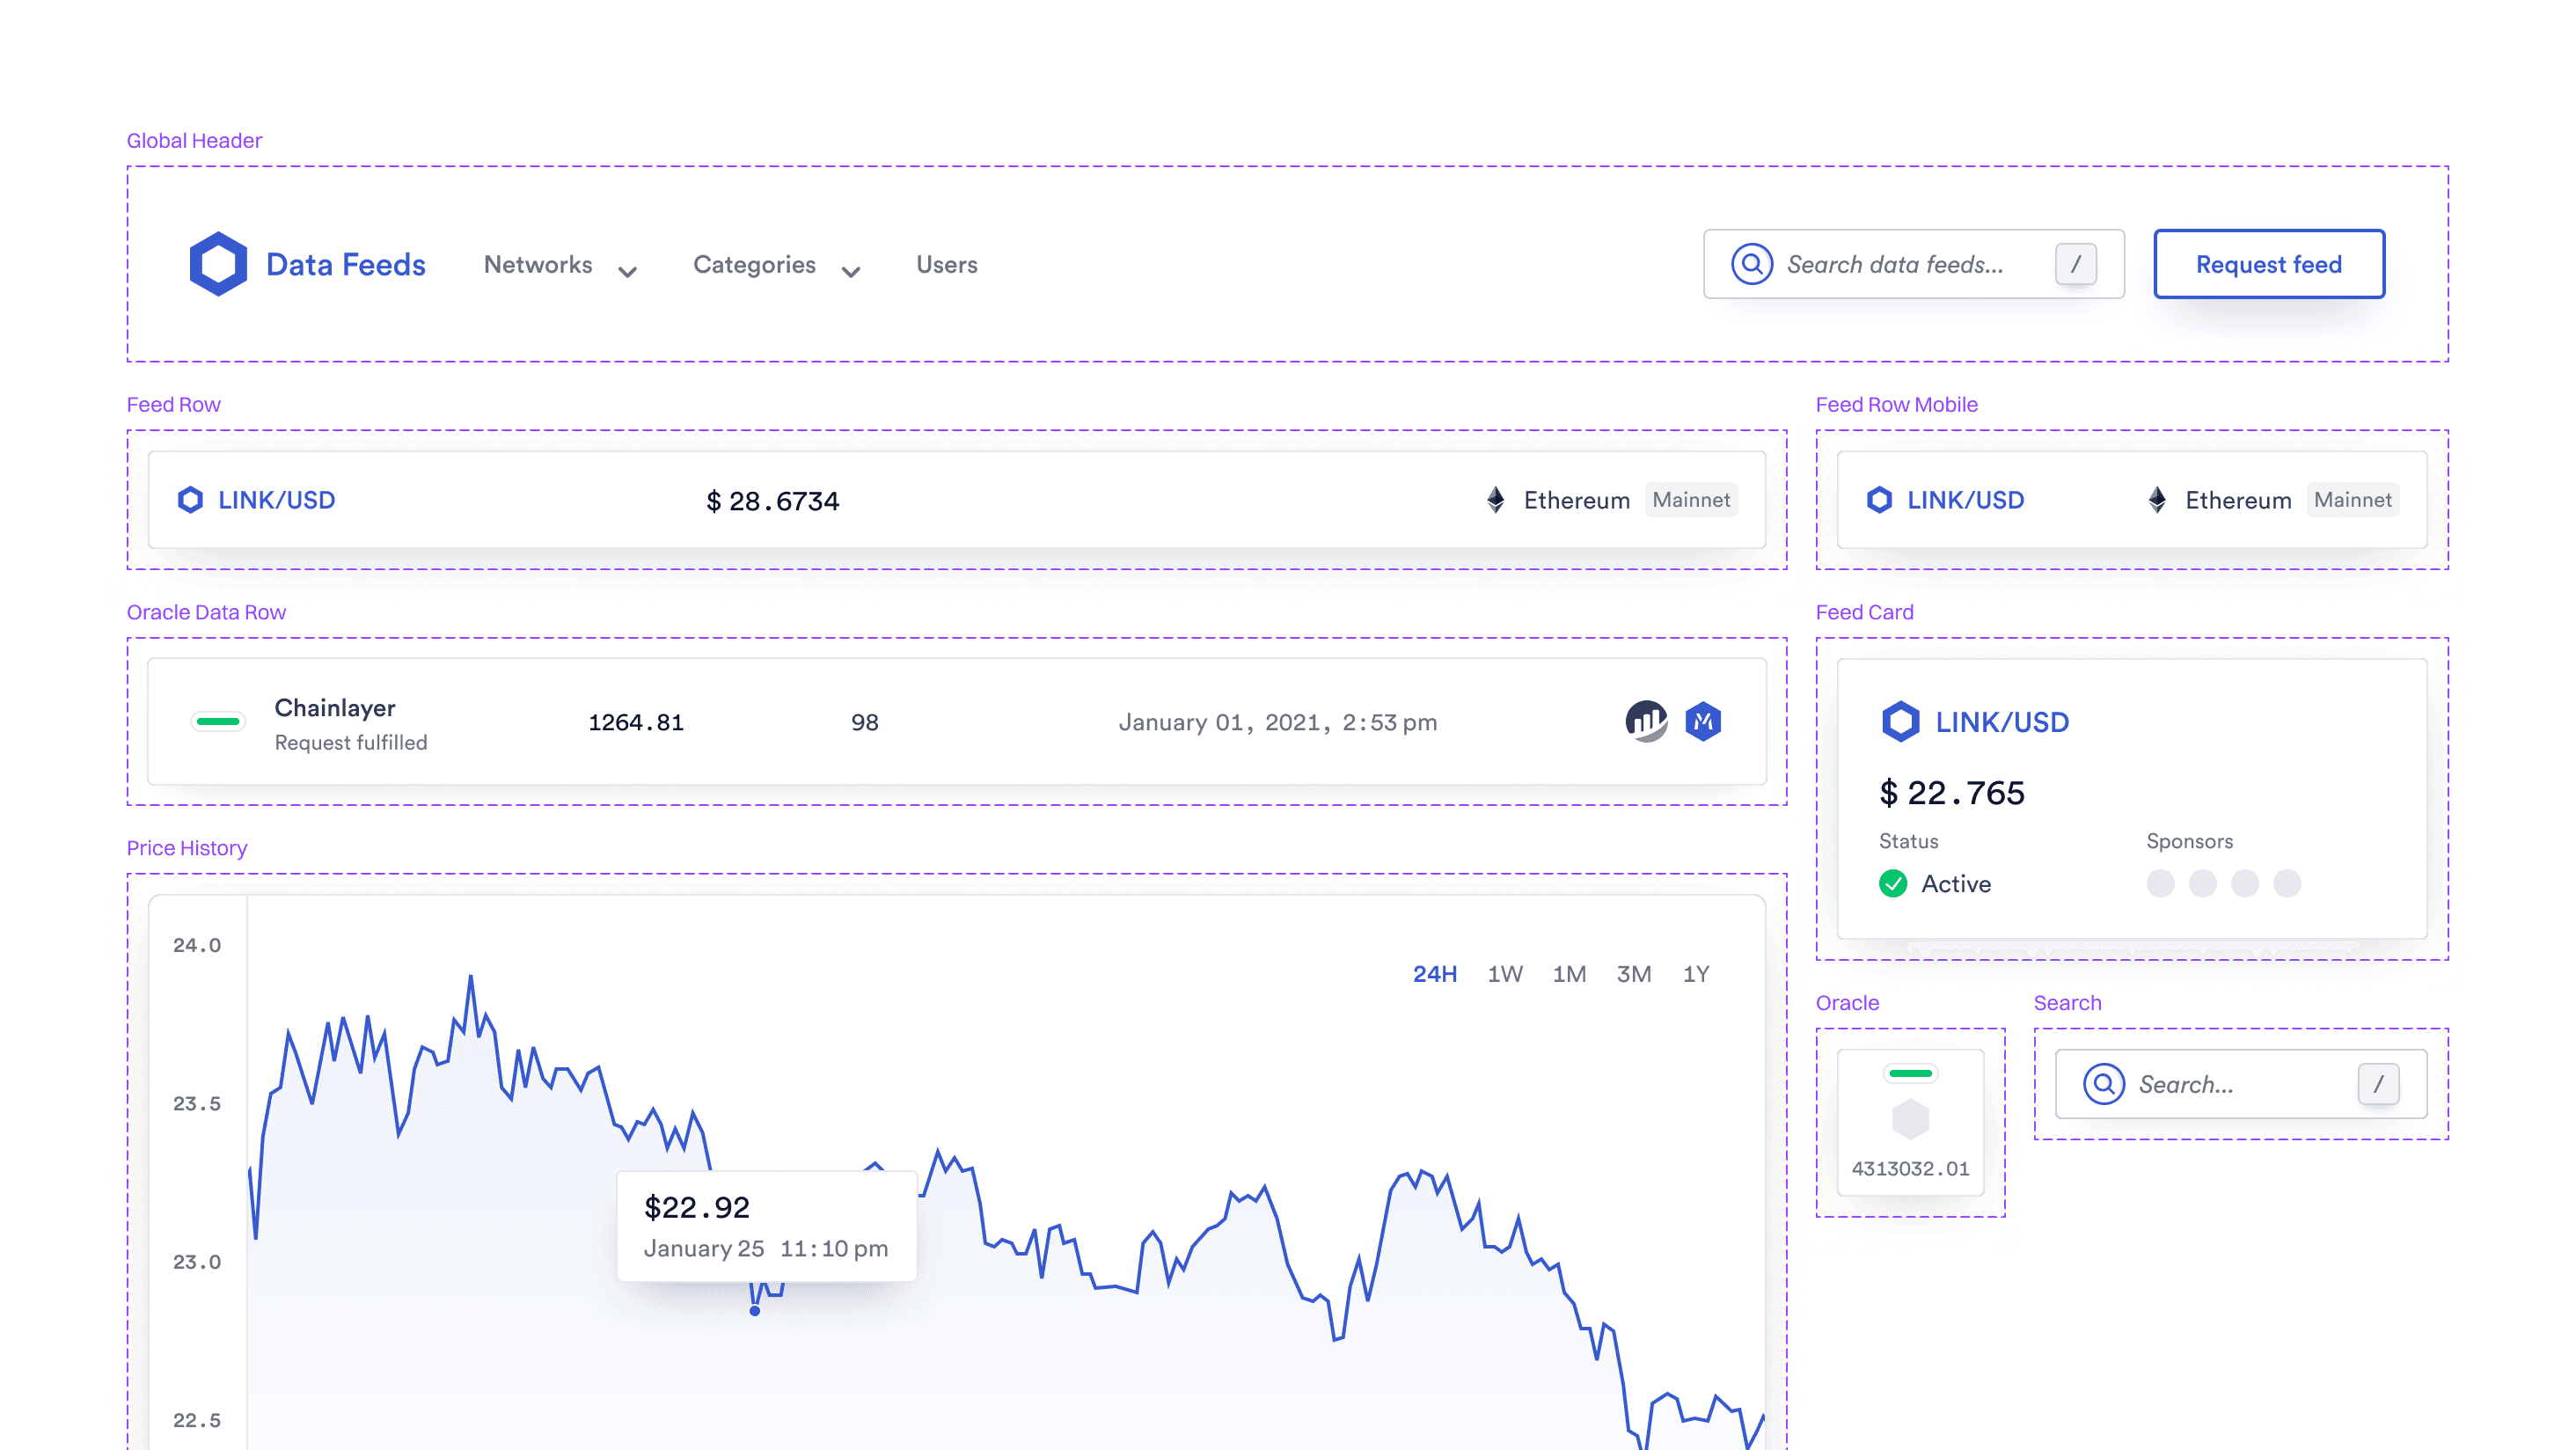
In partnership with engineering, I defined the first reusable component and pattern library at Chainlink, built specifically for data-dense product interfaces. The system covered the patterns Data Feeds depended on: data tables, charts, status indicators, navigation, and responsive behavior across breakpoints. Because it was the first product system at the company, it also became a foundation other Chainlink products could build on as the company grew. The system and the product were built in parallel. That was necessary: the components had to follow the patterns we were still discovering through wireframing and customer testing.
Impact
The redesign strengthened Data Feeds as a core trust surface within the Chainlink ecosystem.
price feeds during my tenure
page templates designed
components in the first Chainlink design system
products adopted the foundation (PegSwap, Faucet, Keepers, VRF)
By clarifying hierarchy and systemizing components, the product was able to scale with the network: from 94 feeds at the start of the redesign to over 380 by the time I left, with no breakdown in legibility or trust signals as more oracles and feed types were added. Developers could evaluate reliability, risk, and implementation details without unnecessary friction even as the surface grew.
The reusable foundation also became the basis for other Chainlink products: PegSwap, Faucet, Keepers, and VRF all adopted patterns and components from the system, accelerating their own development and reinforcing cohesion across the ecosystem.
Aligning the product with the refreshed brand increased cohesion across marketing and product surfaces and positioned Data Feeds as a maintained, production-grade product within the broader Chainlink ecosystem.
Learning
This project reinforced that clarity is foundational in high-stakes systems. Developers building financial infrastructure need immediate confidence in the data they consume. Information hierarchy and transparent status indicators are not cosmetic decisions; they are how a developer decides whether a feed is safe to depend on.
I also learned that infrastructure products demand proactive system thinking. Building Chainlink's first design system made clear that systems thinking can't be retrofitted: the patterns established early shape what's possible later. Designing for scale, partnering tightly with engineering, and building reusable foundations from the start are what let growth compound rather than fragment.
Credits
This work was made possible through close collaboration with product, design, and engineering partners. Special thanks to Julian, Shawn, JT, Deividas, and Ainsley.